. 2009 Sep 29;4(9):e7181.
doi: 10.1371/journal.pone.0007181.

miR-200 enhances mouse breast cancer cell colonization to form distant metastases

Affiliations

miR-200 enhances mouse breast cancer cell colonization to form distant metastases

Derek M Dykxhoorn et al. PLoS One. .

Abstract

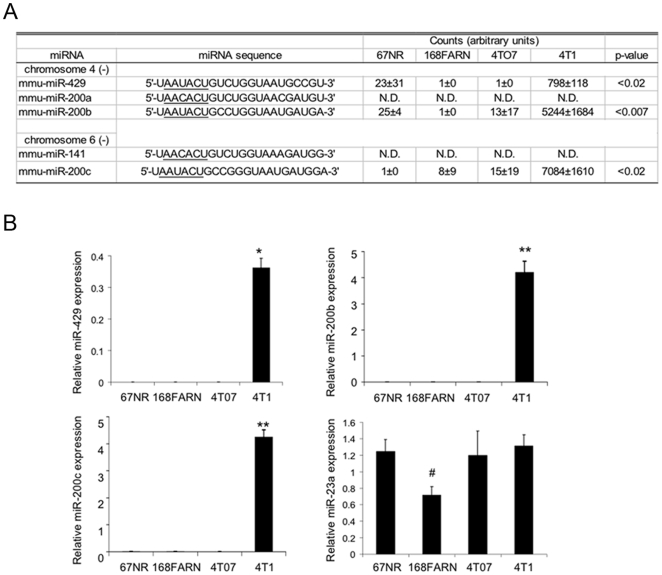
Background: The development of metastases involves the dissociation of cells from the primary tumor to penetrate the basement membrane, invade and then exit the vasculature to seed, and colonize distant tissues. The last step, establishment of macroscopic tumors at distant sites, is the least well understood. Four isogenic mouse breast cancer cell lines (67NR, 168FARN, 4TO7, and 4T1) that differ in their ability to metastasize when implanted into the mammary fat pad are used to model the steps of metastasis. Only 4T1 forms macroscopic lung and liver metastases. Because some miRNAs are dysregulated in cancer and affect cellular transformation, tumor formation, and metastasis, we examined whether changes in miRNA expression might explain the differences in metastasis of these cells.

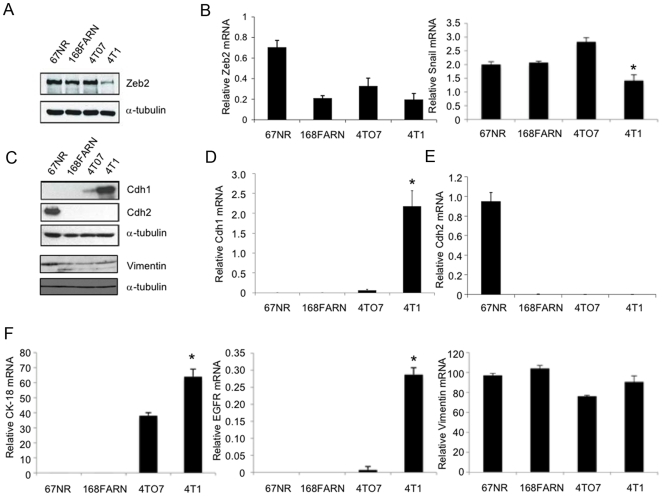
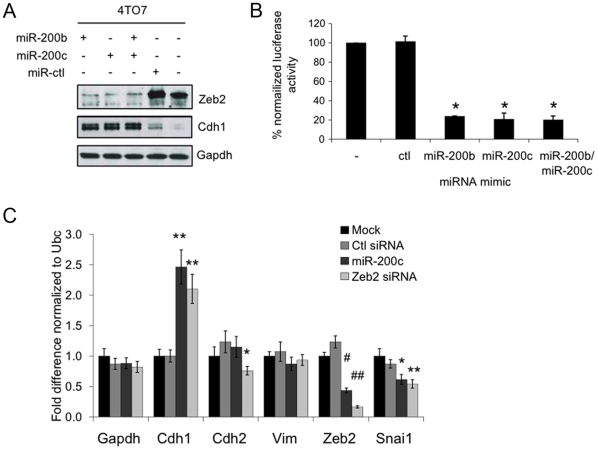
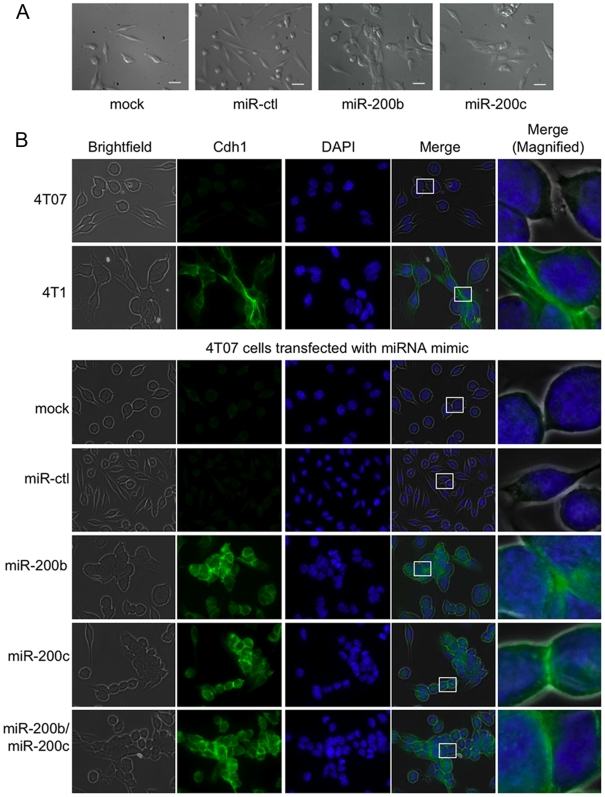
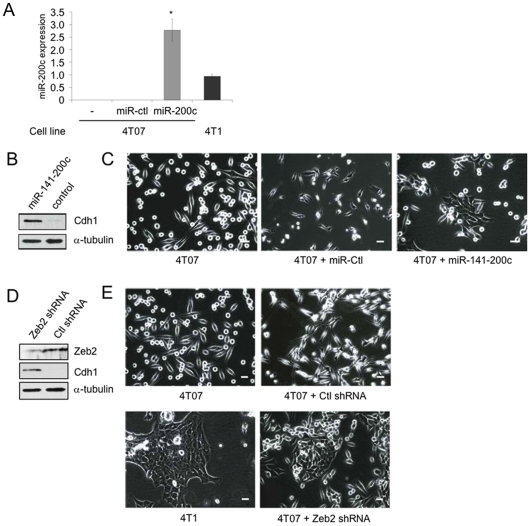
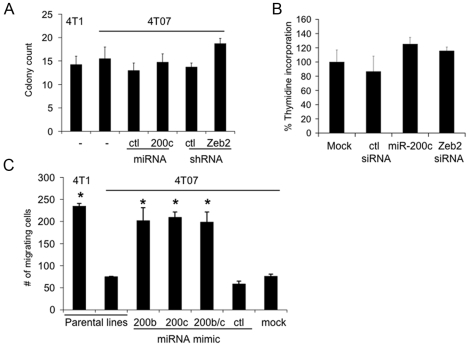
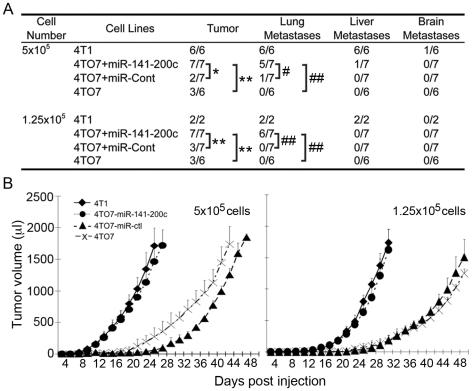
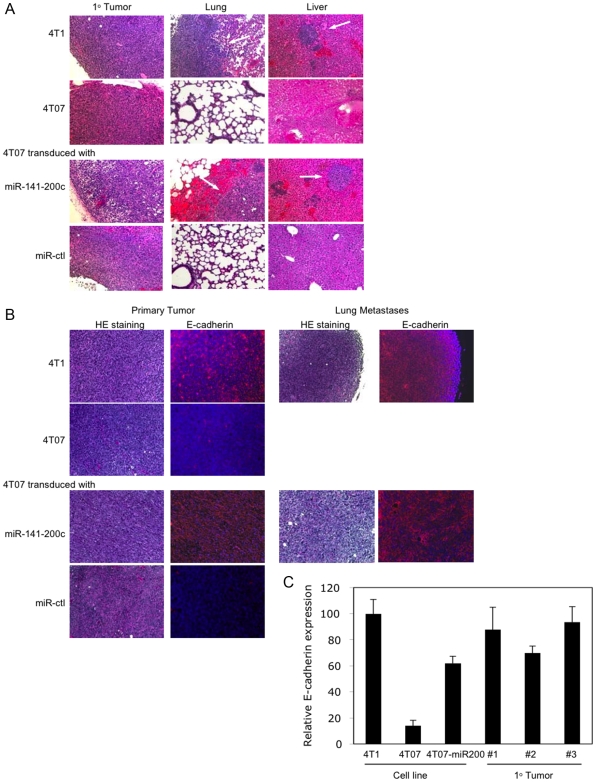
Methodology/principal findings: miRNA expression was analyzed by miRNA microarray and quantitative RT-PCR in isogenic mouse breast cancer cells with distinct metastatic capabilities. 4T1 cells that form macroscopic metastases had elevated expression of miR-200 family miRNAs compared to related cells that invade distant tissues, but are unable to colonize. Moreover, over-expressing miR-200 in 4TO7 cells enabled them to metastasize to lung and liver. These findings are surprising since the miR-200 family was previously shown to promote epithelial characteristics by inhibiting the transcriptional repressor Zeb2 and thereby enhancing E-cadherin expression. We confirmed these findings in these cells. The most metastatic 4T1 cells acquired epithelial properties (high expression of E-cadherin and cytokeratin-18) compared to the less metastatic cells.

Conclusions/significance: Expression of miR-200, which promotes a mesenchymal to epithelial cell transition (MET) by inhibiting Zeb2 expression, unexpectedly enhances macroscopic metastases in mouse breast cancer cell lines. These results suggest that for some tumors, tumor colonization at metastatic sites might be enhanced by MET. Therefore the epithelial nature of a tumor does not predict metastatic outcome.


Conflict of interest statement

Competing Interests: The authors have declared that no competing interests exist.

Figures

Figure 1
Figure 1. MiR-200 family member expression distinguishes highly metastatic 4T1 cells from 67NR, 168FARN, and 4TO7 cells.
(A) miRNA microarray analysis of miR-200 family expression in 4 isogenic mouse breast cancer cell lines. The seed sequence (nucleotides 2–7) of the miRNA is underlined. No significant signal was detected for miR-200a and 141 (N.D. = not detected), averaged signal for all samples below 500), but the remaining miR-200 family members were highly expressed in 4T1 cells relative to the less metastatic 67NR, 168FARN, and 4TO7 cells. (B) miR-200 family expression, analyzed by qRT–PCR and normalized to U6 snRNA, confirms the microarray data. miR-23a, which is expressed in all the lines, was analyzed as a control (*, p<0.001; **, p<0.002; #, p<0.04). Data represent the mean and standard deviation from 3 independent experiments.
Figure 2
Figure 2. Protein expression of Zeb2 protein negatively correlates and E-cadherin positively correlates with miR-200 expression.
(A) Zeb2 protein, analyzed by immunoblot relative to α-tubulin as a loading control, is significantly lower in 4T1 cells. (B) Zeb2 mRNA, analyzed by qRT-PCR and normalized to Gapdh, is higher in 67NR cells but similarly expressed in the other cell lines. Snail mRNA is somewhat lower in 4T1 cells than the other cell lines. (C–E) E-cadherin protein (C) and mRNA (D) expression is only detected in 4T1 cells, while N-cadherin protein (C) and mRNA (E) is restricted to 67NR cells. Vimentin protein (C) is expressed in all 4 cell lines, but expression is greater in 67NR cells, while vimentin mRNA is expressed at similar levels in all 4 cell lines (F). Cytokeratin-18 (CK-18) mRNA is expressed in 4TO7 and 4T1 cells, while Epidermal Growth Factor Receptor (EGFR) is limited to 4T1 cells (F). Protein was analyzed relative to α-tubulin by immunoblot and mRNA was quantified by qRT-PCR relative to Gapdh. Levels of protein and mRNA for both cadherins changed in parallel. The qRT-PCR results represent the mean and standard deviation from three independent experiments (*p<0.01, **p<0.001).
Figure 3
Figure 3. Over-expression of miR-200 in 4TO7 cells down-regulates Zeb2 expression, resulting in increased E-cadherin.
(A) Zeb2 expression decreases and E-Cadherin (Cdh1) expression increases, analyzed by immunoblot relative to Gapdh, after transfection of 4TO7 cells with miR-200b and/or miR-200c. (B) miR-200 regulates the Zeb2 3′-UTR in a luciferase reporter assay. 4TO7 cells were co-transfected with the Zeb2 3′-UTR luciferase plasmid or a control vector and either the control (ctl), miR-200b and/or miR-200c miRNA mimics. The mean and standard deviation of the relative luciferase activity, normalized relative to that of mock-transfected cells, from 3 independent experiments is shown (*p<0.0002). (C) Comparison of mRNA levels of epithelial and mesenchymal markers (Cdh1, Cdh2, vimentin (Vim), Zeb2, and Snai1) in 4TO7 cells transfected with miR-200c mimic or an siRNA targeting Zeb2 (Zeb2 siRNA) or control (ctl) siRNA, analyzed by qRT–PCR normalized to the housekeeping gene Ubc. miR-200c expression increased Cdh1 mRNA, an epithelial marker, and decreased Snai1 and Zeb2, mesenchymal markers, but had no effect on N-cadherin (cdh2) or vimentin (Vim). Knocking down Zeb2 had a similar effect as expressing miR-200c, except that Cdh2 mRNA was also significantly suppressed by reducing Zeb2. Mean and standard deviation for 3 independent experiments are shown relative to the results for mock-transfected cells (*,p<0.05, **,p<0.01, ***,p<0.005, #,p<0.001 and ##,p<0.0001).
Figure 4
Figure 4. Over-expression of miR-200 in 4TO7 cells converts fibroblastic cells to an epithelial morphology.
(A) Phase contrast microscopy of 4TO7 cells that were either mock treated or transfected with the miRNA control (ctl), miR-200b, or miR-200c mimic. The white bar represents 10 µm. (B) E-cadherin expression visualized by fluorescence microscopy of parental 4T1 and 4TO7 cells (top) and 4TO7 cells that were transfected with miR-200b and/or miR-200c or control mimics (bottom). 4TO7 cells treated with either of the miR-200 mimics adopted an epithelial-like morphology and expressed high levels of E-cadherin, similar to the highly metastatic 4T1 cells. E-cadherin (Cdh1) concentration at the cell-cell junction is shown in the magnified image. Cell nuclei were stained with DAPI.
Figure 5
Figure 5. Stable miR-141-200c over-expression or Zeb2 silencing in 4TO7 cells promoted adoption of an epithelial-like morphology.
(A) miR-200c expression is increased in 4TO7 cells stably expressing the miR-141-200c cluster from a retroviral vector. miR-200c levels, normalized to U6 snRNA expression, are shown relative to expression in 4T1 cells. Mean and standard deviation of 3 independent experiments are shown (*, p = 0.02, relative to 4T1 cells). (B) Stable over-expression of the miR-141-200c cluster leads to an increase in E-cadherin expression, as measured by immunoblot relative to α-tubulin. (C) The stable miR-141-200c-expressing 4TO7 cells adopt an epithelial morphology compared to the control transfected cells or the parental cells when examined by phase contrast microscopy. 4TO7 cells stably expressing a Zeb2 shRNA had reduced Zeb2 and concomitantly increased E-cadherin protein by immunoblot (D), and altered morphology from a fibroblastic to an epithelial morphology (E). 4T1 cells are shown for comparison. The white bars represent 10 µm.
Figure 6
Figure 6. miR-200 enhances 4TO7 cells migration through a basement membrane, but does not affect cell proliferation.
(A) Exogenous expression of the miR-141-200c cluster (compared to the control vector expressing luciferase shRNA) or Zeb2 shRNA (compared to a luciferase shRNA construct) in 4TO7 cells does not alter colony growth in soft agar. Parental 4TO7 and 4T1 cells also are equally efficient at forming colonies. (B) Cell proliferation as measured by thymidine incorporation is also unaffected in 4TO7 cells expressing miR-200c mimic or Zeb2 siRNA. The mean and standard deviation of 6 independent experiments is shown. (C) Transient over-expression of miR-200b and/or miR-200c enhances the migration of the 4TO7 cells through a basement membrane to the same level as the highly invasive 4T1 cells. The mean and standard deviation from analyzing five fields from triplicate samples is shown (*, p<0.01, compared to untreated (parental) 4TO7 cells).
Figure 7
Figure 7. 4TO7 cells stably over-expressing miR-141-200c form tumors more rapidly that are more likely to metastasize.
(A) Primary tumor and metastases is enhanced in 4TO7 cells stably over-expressing the miR-141-200c cluster. The indicated number of cells was injected in the mammary fat pad of female mice (*,p = 0.02; **, p = 0.07; #, p = 0.1; ##, p = 0.005). (B) Growth curves for primary tumors in mice injected with either 5×10⁵ (left) or 1.25×10⁵ cells (right).
Figure 8
Figure 8. Primary tumors and metastases of 4TO7 cells stably expressing the miR-141-200c cluster express E-cadherin.
(A) Representative primary mammary tumors and lung and liver tissue sections stained with hematoxylin and eosin from mice implanted with parental 4T1 and 4TO7 cells or 4TO7 cells stably-expressing miR-141-200c or control vector. 4TO7 cells and 4TO7 cells expressing the control miRNA (miR-ctl) did not form metastases. (B) Primary tumors and lung metastases formed from 4T1 cells and 4TO7 cells transduced with miR-141-200c retrovirus continue to express E-cadherin, while primary tumors from 4TO7 parental cells or 4TO7 cells infected with a control retrovirus remain E-cadherin-. (C) Primary tumors from 3 mice implanted with 4TO7 cells stably expressing miR-141-200c showed high levels of E-cadherin mRNA, analyzed by qRT-PCR and normalized to Gapdh, compared to parental 4TO7 cells. Mean and standard deviation from triplicate samples of each cell line or tumor are shown.

References

    1. Bartel DP. MicroRNAs: genomics, biogenesis, mechanism, and function. Cell. 2004;116:281–297. - PubMed
    1. Dykxhoorn DM, Chowdhury D, Lieberman J. RNA interference and cancer: endogenous pathways and therapeutic approaches. Adv Exp Med Biol. 2008;615:299–329. - PubMed
    1. Lim LP, Lau NC, Garrett-Engele P, Grimson A, Schelter JM, et al. Microarray analysis shows that some microRNAs downregulate large numbers of target mRNAs. Nature. 2005;433:769–773. - PubMed
    1. Cimmino A, Calin GA, Fabbri M, Iorio MV, Ferracin M, et al. miR-15 and miR-16 induce apoptosis by targeting BCL2. Proc Natl Acad Sci U S A. 2005;102:13944–13949. - PMC - PubMed
    1. Eis PS, Tam W, Sun L, Chadburn A, Li Z, et al. Accumulation of miR-155 and BIC RNA in human B cell lymphomas. Proc Natl Acad Sci U S A. 2005;102:3627–3632. - PMC - PubMed

Publication types