. 2008 May 9:2:81-112.

Bioactive and structural metabolites of pseudomonas and burkholderia species causal agents of cultivated mushrooms diseases

Affiliations

Bioactive and structural metabolites of pseudomonas and burkholderia species causal agents of cultivated mushrooms diseases

Anna Andolfi et al. Perspect Medicin Chem. .

Abstract

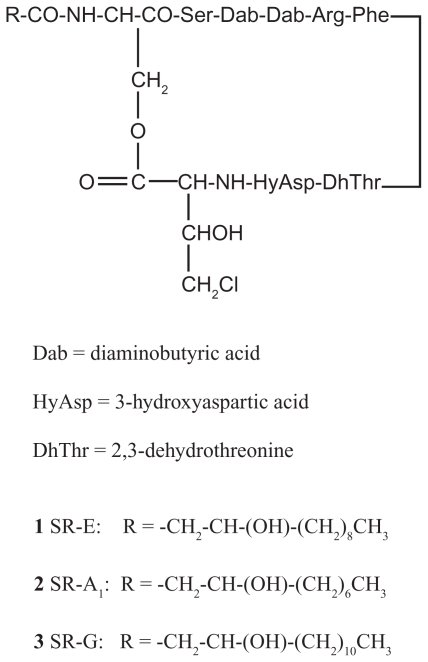
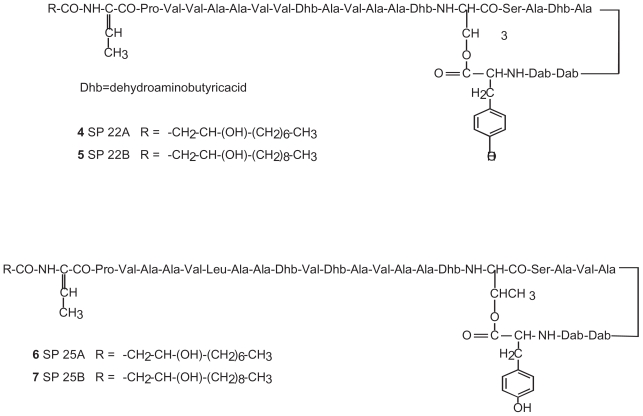
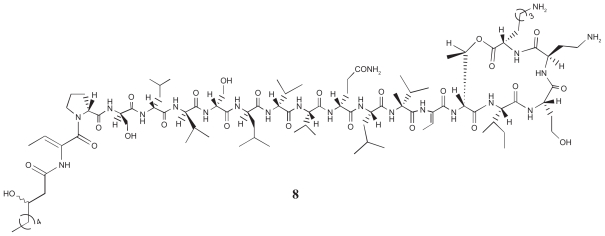
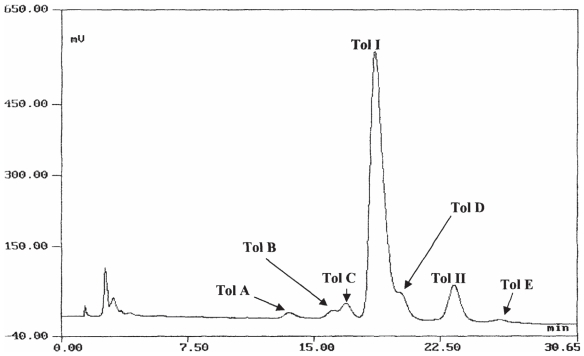
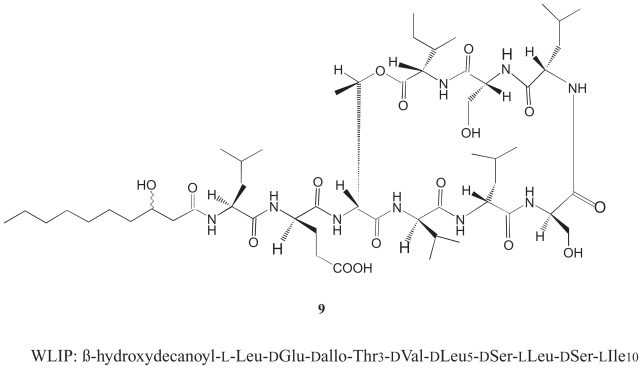
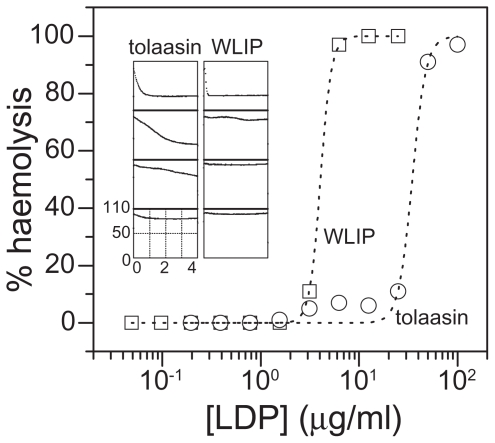
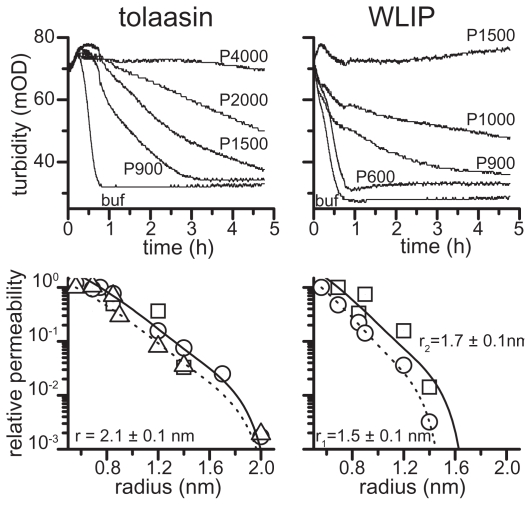
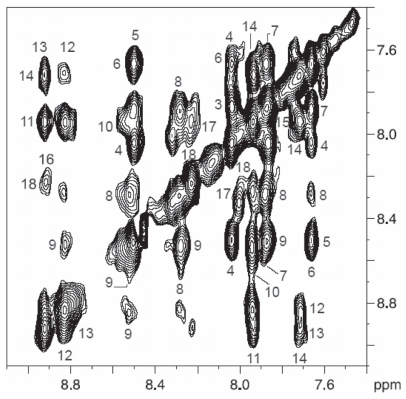
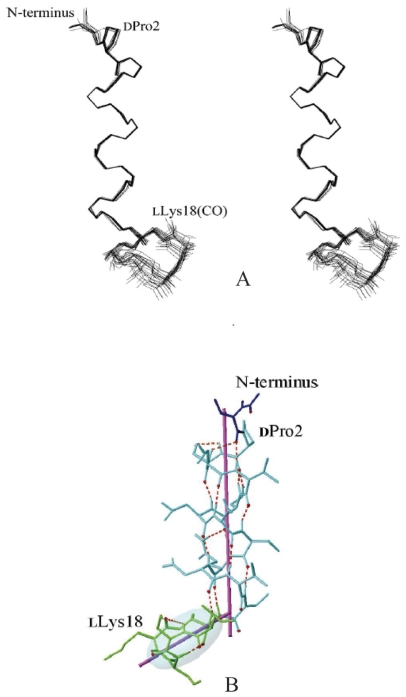
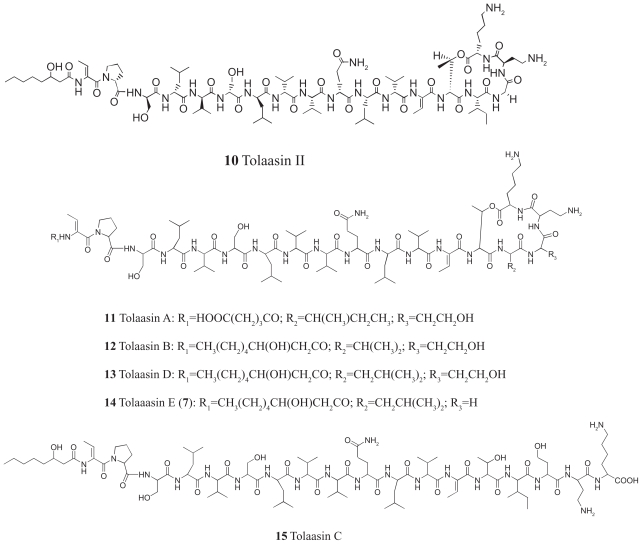
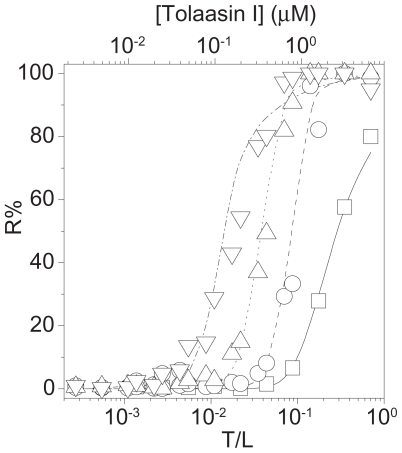
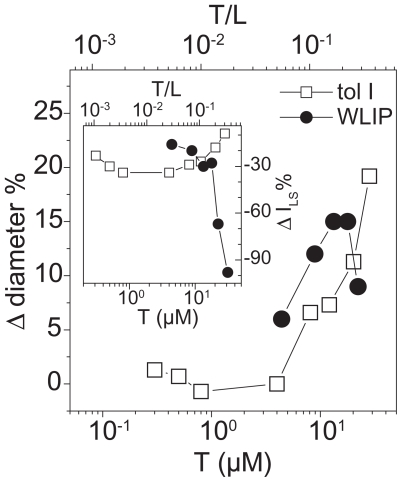
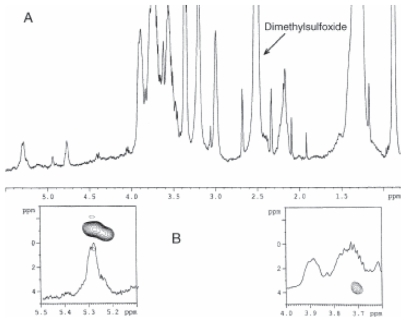
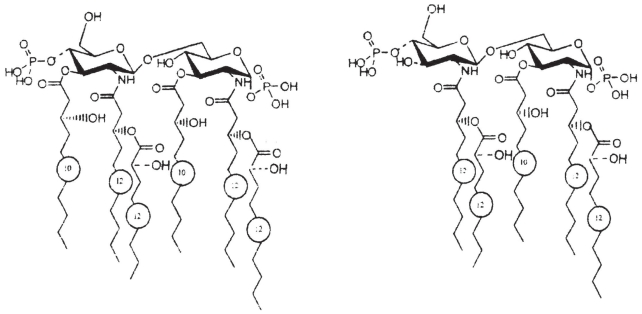
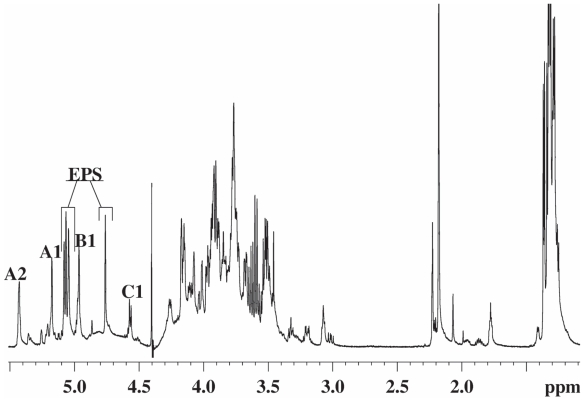
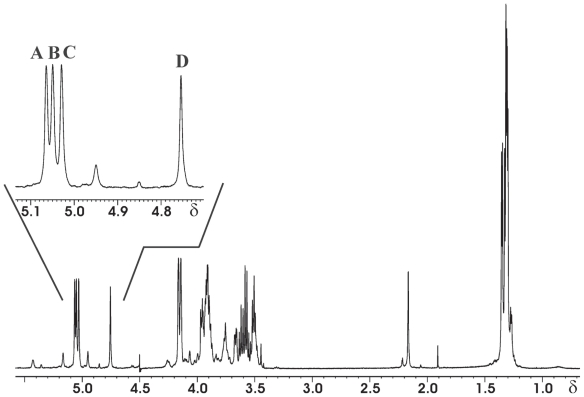
Pseudomonas tolaasii, P. reactans and Burkholderia gladioli pv. agaricicola, are responsible of diseases on some species of cultivated mushrooms. The main bioactive metabolites produced by both Pseudomonas strains are the lipodepsipeptides (LDPs) tolaasin I and II and the so called White Line Inducing Principle (WLIP), respectively, LDPs which have been extensively studied for their role in the disease process and for their biological properties. In particular, their antimicrobial activity and the alteration of biological and model membranes (red blood cell and liposomes) was established. In the case of tolaasin I interaction with membranes was also related to the tridimensional structure in solution as determined by NMR combined with molecular dynamic calculation techniques. Recently, five news minor tolaasins, tolaasins A-E, were isolated from the culture filtrates of P. tolaasii and their chemical structure was determined by extensive use of NMR and MS spectroscopy. Furthermore, their antimicrobial activity was evaluated on target micro-organisms (fungi-including the cultivated mushrooms Agaricus bisporus, Lentinus edodes, and Pleurotus spp.-chromista, yeast and bacteria). The Gram positive bacteria resulted the most sensible and a significant structure-activity relationships was apparent. The isolation and structure determination of bioactive metabolites produced by B. gladioli pv. agaricicola are still in progress but preliminary results indicate their peptide nature. Furthermore, the exopolysaccharide (EPS) from the culture filtrates of B. gladioli pv. agaricicola, as well as the O-chain and lipid A, from the lipopolysaccharide (LPS) of the three bacteria, were isolated and the structures determined.

Keywords: P. reactans and Burkholderia gladioli pv. agaricicola; Pseudomonas tolaasii; antimicrobial activity; cultivated mushrooms and bacterial diseases; exopolysaccharides and lipopolysaccharides; lipodepsipetides; mycopathogenic bacteria; permeabilising effects on membranes.


Figures

Figure 1
Figure 1
Structure of syringomicins A1, E and G (1, 2 and 3, respectively).
Figure 2
Figure 2
Structure of syringopeptins 22A, 22B, 25A and 25B (4, 5, 6 and 7, respectively).
Figure 3
Figure 3
Tolaasin I (8) primary structure.
Figure 4
Figure 4
HPLC profile of crude tolaasins preparation.
Figure 5
Figure 5
WLIP Primary structure (9).
Figure 6
Figure 6
Brown lesions on tissue blocks of Agaricus bisporus (lower three blocks in each treatment), caused by deposition of 5 μl solutions containing 5.12 μg of WLIP (A) and 0.64 μg of tolaasin I (B), respectively. On upper blocks, 5 μl of sterile water was deposited.
Figure 7
Figure 7
Dose dependence of the haemolytic activity of tolaasin I (circles) and WLIP (squares) after 4 hours at room temperature. Dotted lines are best fit experimental data points with Hill equation. Hill coefficients are 6.3 and 8.0 for tolaasin I and WLIP, respectively. Inset: Set of traces recorded on the microplate reader of kinetics of haemolysis of RBC exposed to 2 step sequential dilutions of tolaasin I (left) and WLIP (right), from top to bottom. Starting concentration (top panels) were 100 μg/ml for tolaasin I and 6.25 μg/ml for WLIP. The decrease of turbidity over time indicated the disappearance of intact RBC. All panels have the same linear axis, ranging from 0 to 4 hours and from 0 to 110 mOD for x- and y-axes, respectively.
Figure 8
Figure 8
Haemolysis in the presence of osmotic protectants and Renkin fit. Upper panels: Representative traces of decrease in turbidity of a RBC suspension in the presence of different external PEG osmolites and constant LDP concentrations (i.e. 100 μg/ml and 6.25 μg/ml for tolaasin I and WLIP, respectively). PEG size is indicated next to each trace. Lower panels: Renkin representation of data collected in experiments similar to those reported in the upper panels. Curves through points are best fits according to Renkin equation [see text; Schultz and Solomon (1961); Ginsburg and Stein (1987)], which gives a pore radius for tolaasin I of 2.1 ± 0.1 nm. This value does not dependent on LDP concentration, at least at the concentrations used in this study (i.e. 50–100 μg/ml): dotted is the best fit of data collected at [tolaasin I] = 76 μg/ml (triangles, 2 × C50), solid line refers to best fit of data collected at [tolaasin I] = 50 (squares, 1.5 × C50) and 100 μg/ml (circles, 3 × C50). On the other hand, WLIP shows different values of pore radius, ranging from 1.5 to 1.7 nm depending on toxin concentration. Dotted line is the best fit of data collected at [WLIP] = 6.25 μg/ml (circles, 1.5 × C50), solid line refers to best fit of data collected at [WLIP] = 9 μg/ml (squares, 2 × C50).
Figure 9
Figure 9
The amide region of NOESY spectrum of tolaasin I in 1H2O/2H2O (90/10 v/v) in the presence of SDS with a mixing time of 0.10 s, 300 K, pH 7.0. Where space permits, the cross-peaks are labeled with the sequence number of amino acid residues.
Figure 10
Figure 10
Calculated structures of tolaasin I (A) MOLMOL stereoview of the best-fit superposition of the 20 lowest energy rSA/rEMconformations of tolaasin. Backbone atoms of residues 2–14 were used for the best fit. (B) Stickgolf-club” like tolaasin I conformation. Dotted lines indicate hydrogen bondsalong the left-handed α-helix. The helical axis inside the helix is also represented. The shaded area simulates the ellipsoid that covers most of the backbone atoms of the lactone ring, and its largest axisis also shown.
Figure 11
Figure 11
Structures of tolaasins II and A–E (1015).
Figure 12
Figure 12
Dose dependence activity of tolaasin I on liposomes with different lipid composition: Calcein loaded liposomes were exposed to different peptide concentrations. The percentage of calcein release was determined after 45 min as a function of the toxin/lipid ratio (T/L) and expressed as % of the maximal value obtained with TritonX-100. Experiments were done at constant lipid concentration (about 9 μM). The true toxin concentration used was reported in the upper scale of the panel. Lines through the points are best fit according to the statistical model described in the text. Best values of fitting parameters are reported in Table 1. Vesicles were prepared with the following compositions expressed in molar ratio: (down triangle) PC:SM (50:50), (up triangle) PC:SM:Chol (50:33:16.5), (circle) PC:SM:Chol (50:16.5:33), (square) PC:Chol (50:50).
Figure 13
Figure 13
Effect of toxins on vesicle size as determined by dynamic light scattering: The treatment of phosphatidylcholine vesicle with tolaasin I (open square) and WLIP (close circle) caused changes in vesicle average size (Δ diameter) which was reported vs the toxin concentration (T), normalized to the vesicle diameter in the absence of toxin. Experiments were obtained at constant lipid concentration (80 μM). The toxin/lipid ratio (T/L) was reported in the upper scale of the same panel. Inset. In this case we analyzed the variation of the scattered light intensity (Δ ILS), normalized to the intensity value in the absence of toxin. Other parameters are as above.
Figure 14
Figure 14
Differential spectra after H/D exchange of the WLIP amide protons: Analysis of differences in the amide I band of films of WLIP samples deposited from a buffer solution (B, dashed line), TFE (T, dotted line), HFIP (H, solid line), SDS (S, thick dashed line) and after binding to the lipid membrane (L, thick dotted-dashed line). Differential spectra were obtained by subtracting the hydrogenated spectra of WLIP in the different environments from the corresponding deuterated spectra. (Inset) Area of negative peaks between 1710 and 1660 cm−1. All the differences are between normalized spectra, i.e. with the amide I’ peak area set at 1.
Figure 15
Figure 15
FTIR-ATR spectra of WLIP in buffer and in lipid mimetic environments: (A) Analysis of the amide I’ band of deuterated films of WLIP samples deposited from a buffer solution (buffer, thick dotted line) or after binding to the lipid membrane (POPC, solid line). The original spectrum (POPC) was deconvoluted and curve fitted to resolve the component frequencies. The corresponding Gaussian bands are reported as dotted lines, and their sum as a thick dashed line superimposed to the original spectrum. (B) Differential spectra were obtained by subtracting the deuterated spectrum of the soluble form in buffer from that in TFE (1), in HFIP (3), in SDS (2) or in presence of the lipid phase (4).
Figure 16
Figure 16
Analysis of FTIR-ATR spectra of tolaasin I in POPC layers with polarizer: (A) Spectra were taken with either parallel (0°) or perpendicular (90°) polarization. The amide I’ region of tolaasin I bound to vesicles was reported after subtraction of the lipid contribution. The best fit curve with Gaussian components (dotted lines) was superimposed as a thick dashed line to the 90° polarized trace (solid line). The absorption bands in the parallel and perpendicular configuration were used to calculate the orientation of the corresponding structural element as reported in Table 7. Bands are: h (helix), β (β-structure), r (random). (B) Dichroic spectrum obtained by subtracting the 90° polarized spectrum (after multiplication by Riso i.e. 1.54) from that at 0°.
Figure 17
Figure 17
1H NMR spectrum of the O-chain of the LPS from Pseudomonas tolaasii.
Figure 18
Figure 18
Relevant HMBC correlation of the anomeric region of the O-chain from Pseudomonas tolaasii.
Figure 19
Figure 19
1H NMR spectrum of the O-chain polysacharide from Pseudomonas reactans.
Figure 20
Figure 20
13C NMR spectrum of the O-chain polysacharide from Pseudomonas reactans.
Figure 21
Figure 21
(A) 1H NMR spectrum and (B) 1H, 31P HMQC spectrum of de-O-acylated lipid A from Pseudomonas reactans.
Figure 22
Figure 22
Structure of the main lipid A from Pseudomonas reactans.
Figure 23
Figure 23
1H NMR spectrum of the O-specific polysaccharide OPS of the LPS from Burkholderia gladioli pv. agaricicola.
Figure 24
Figure 24
1H NMR spectrum of the capsular polysaccharide isolated from Burkholderia gladioli pv. agaricicola.

References

    1. Andreu D, Rivas L. Animal antimicrobial peptides: an overview. Biopolymers. 1998;47:415–3. - PubMed
    1. Arrebola E, Cazorla FM, Duran VE, et al. Mangotoxin: a novel antimetabolite toxin produced by Pseudomonas syringae inhibiting ornithine/arginine biosynthesis. Physiol. Mol. Plant Pathol. 2003;63:117–27.
    1. Atkey PT, Fermor TR, Lincoln SP. In: Maher MJ, editor. Proceedings of the 13th International Congress on The Science and Cultivation of Edible Fungi; Rotterdam: A. A. Balkema; 1991. p. 431.
    1. Avrahami D, Shai Y. Conjugation of a magainin analogue with lipophilic acids controls hydrophobicity, solution assembly, and cell selectivity. Biochemistry. 2002;41:2254–63. - PubMed
    1. Ballio A, Bossa F, Di Giorgio A, et al. Solution conformation of the Pseudomonas syringae pv. syringae phytotoxic lipodepsipeptide syringopeptin 25-A. Two-dimensional NMR, distance geometry and molecular dynamics. Eur. J. Biochem. 1995;234:747–58. - PubMed

LinkOut - more resources