. 2010 Mar;59(3):419-29.
doi: 10.1007/s00262-009-0761-0. Epub 2009 Sep 29.

Hematopoietic progenitor kinase 1 is a critical component of prostaglandin E2-mediated suppression of the anti-tumor immune response

Affiliations

Hematopoietic progenitor kinase 1 is a critical component of prostaglandin E2-mediated suppression of the anti-tumor immune response

Saba Alzabin et al. Cancer Immunol Immunother. 2010 Mar.

Abstract

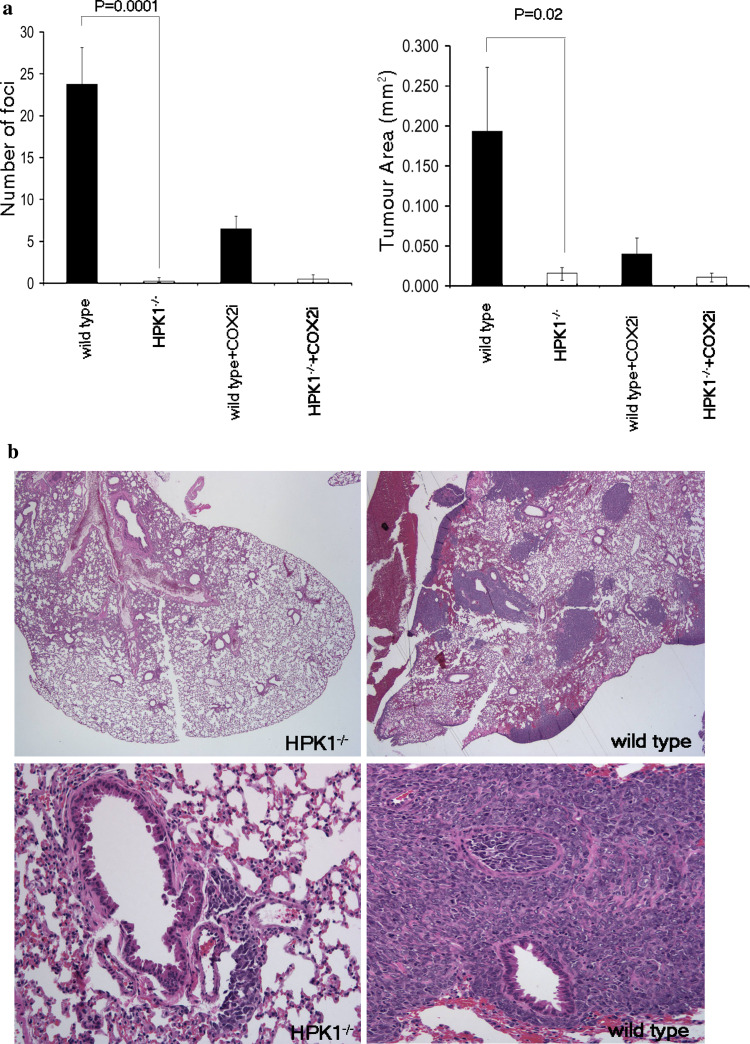
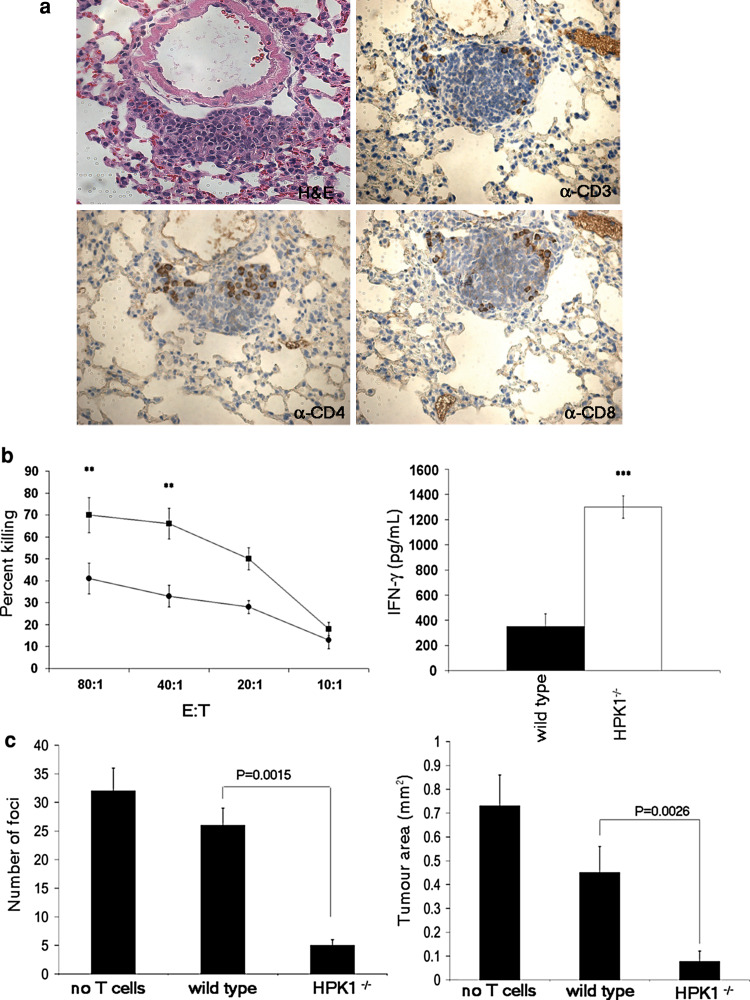
Lung cancer is the leading cause of cancer-related mortality in the world, resulting in over a million deaths each year. Non-small cell lung cancers (NSCLCs) are characterized by a poor immunogenic response, which may be the result of immunosuppressive factors such as prostaglandin E2 (PGE(2)) present in the tumor environment. The effect of PGE(2) in the suppression of anti-tumor immunity and its promotion of tumor survival has been established for over three decades, but with limited mechanistic understanding. We have previously reported that PGE(2) activates hematopoietic progenitor kinase 1 (HPK1), a hematopoietic-specific kinase known to negatively regulate T-cell receptor signaling. Here, we report that mice genetically lacking HPK1 resist the growth of PGE(2)-producing Lewis lung carcinoma (LLC). The presence of tumor-infiltrating lymphocytes (TILs) and T-cell transfer into T cell-deficient mice revealed that tumor rejection is T cell mediated. Further analysis demonstrated that this may be significantly due to the ability of HPK1 (-/-) T cells to withstand PGE(2)-mediated suppression of T-cell proliferation, IL-2 production, and apoptosis. We conclude that PGE(2) utilizes HPK1 to suppress T cell-mediated anti-tumor responses.


Figures

Fig. 1
Fig. 1
Generation of HPK1-deficient mice. a Gene-targeting strategy. Top a portion of the wild-type murine HPK1 locus showing relevant restriction sites: BamHI, EcoRI, XhoI, and XbaI. Exons are shown as filled rectangles and the position of the 3′ flanking probe is indicated. The structure of the targeting vector (middle) and the mutant locus (bottom) are also shown. b PCR-based genomic analysis for HPK1 −/− mice. Tail genomic DNA was subjected to PCR analysis using primer pairs specific for the wild-type HPK1 allele and neo-specific primer. A 726-nucleotide fragment is expected for the wild-type allele and a 670-nucleotide fragment for the HPK1-disrupted allele. c Southern blot analysis of tail DNA isolated from wild-type, heterozygous (HPK1 +/−), and HPK1 −/− mice. Genomic DNA was digested with EcoRI and hybridized with the 3′ flanking probe. A 2.4-kb fragment is expected for the wild-type allele and a 3.8-kb fragment would indicate the presence of the neomycin cassette. d Western blot analysis of protein lysates from spleens of wild-type and knockout mice using antibodies against HPK1. e CD4+ and CD8+ ratios in the thymus (thy), lymph nodes (ln) and spleen (sp) of wild-type and HPK1 −/− mice
Fig. 2
Fig. 2
Resistance of HPK1 −/− T cells to PGE2 inhibition of IL-2 production and proliferation. T cells stimulated with 1 µg/mL anti-CD3 and 0.5 µg/mL anti-CD28 in the presence or absence of 1 nM PGE2. a IL-2 levels of supernatants measured by ELISA (left panel) or intracellular staining (right panel). b T-cell proliferation by 3H thymidine incorporation. 3H thymidine was added in the last 18 h of stimulation. c Line graphs representing proliferation (left panel) or IL-2 levels (right panel) at varying anti-CD3 concentrations, as shown on the X-axis. Cells were stimulated in 96-well plates for 3 days with the varying anti-CD3 concentrations, and a fixed amount of CD28 (0.5 µg/mL) in the presence or absence of 1nM PGE2. As shown, filled squares are HPK1 −/− and filled circles are wild-type T cells. Solid symbols indicate conditions without PGE2 and open symbols are with PGE2. d The degree of inhibition of proliferation on the addition of PGE2 was compared when HPK1 −/− or wild-type T cells produced comparable levels of IL-2 at 0.25 or 2 µg/mL of anti-CD3 used for stimulation, respectively. Error bars represent the standard error of the mean of an experiment done in triplicate (*P < 0.05)
Fig. 3
Fig. 3
Resistance to apoptosis by HPK1 −/− T cells. HPK1 −/− or wild-type T cells, in the absence or presence of PGE2, were stained with 7AAD and Annexin V. The 7AAD negative population, which represents living cells, was assessed for Annexin V staining
Fig. 4
Fig. 4
HPK1 −/− mice are resistant to the growth of Lewis lung carcinoma. 3LL cells were injected intravenously into HPK1 −/− or wild-type mice, in the presence or absence of a COX-2 inhibitor (COX2i), and tumor burden in the lungs was assessed after 14 days. a Total number of lung foci and total tumor area in the lungs with H&E staining. White and black bars represent HPK1 −/− and wild-type conditions, respectively. b With H&E staining, a 20× magnification (top panels) of a single lobe from the lungs of HPK1 −/− or wild-type mice, respectively. A single tumor focus of 60× magnification from HPK1 −/− or wild-type lungs (bottom panels). P values shown represent the standard error of the mean of an experiment (n = 6)
Fig. 5
Fig. 5
Enhanced anti-tumor T-cell response in HPK1 −/− mice. a 40× magnification of H&E staining with superimposed IHC of anti-CD3, CD4, and CD8 staining, respectively, of a tumor focus from HPK1 −/− lungs. b Varying ratios of splenocytes, from 3LL-injected HPK1 −/− (filled squares) or wild-type (filled circles) mice were co-cultured with irradiated, 51Cr-labeled 3LL cells. Irradiated 3LL cells were co-cultured with splenocytes from tumor-bearing HPK1 −/− (white bar) or wild-type (black bar) mice, and supernatants were collected for IFN-γ ELISA (n = 3, **P < 0.01, ***P < 0.001). c Purified T cells from wild-type or HPK1 −/− mice were injected intravenously with 3LL cells into RAG2 −/− mice. The number of tumor lung foci and the tumor area was assessed as in Fig. 4 (n = 5). Error bars in all experiments represent the standard error of the mean of an experiment

References

    1. Arnold R, Patzak IM, Neuhaus B, Vancauwenbergh S, Veillette A, Van Lint J, Kiefer F. Activation of hematopoietic progenitor kinase 1 involves relocation, autophosphorylation, and transphosphorylation by protein kinase D1. Mol Cell Biol. 2005;25:2364–2383. doi: 10.1128/MCB.25.6.2364-2383.2005. - DOI - PMC - PubMed
    1. Azuma M, Ito D, Yagita H, Okumura K, Phillips JH, Lanier LL, Somoza C. B70 antigen is a second ligand for CTLA-4 and CD28. Nature. 1993;366:76–79. doi: 10.1038/366076a0. - DOI - PubMed
    1. Bode JG, Nimmesgern A, Schmitz J, Schaper F, Schmitt M, Frisch W, Haussinger D, Heinrich PC, Graeve L. LPS and TNFalpha induce SOCS3 mRNA and inhibit IL-6-induced activation of STAT3 in macrophages. FEBS Lett. 1999;463:365–370. doi: 10.1016/S0014-5793(99)01662-2. - DOI - PubMed
    1. Brenner D, Golks A, Becker M, Muller W, Frey CR, Novak R, Melamed D, Kiefer F, Krammer PH, Arnold R. Caspase-cleaved HPK1 induces CD95L-independent activation-induced cell death in T and B lymphocytes. Blood. 2007;110:3968–3977. doi: 10.1182/blood-2007-01-071167. - DOI - PubMed
    1. Brenner D, Golks A, Kiefer F, Krammer PH, Arnold R. Activation or suppression of NFkappaB by HPK1 determines sensitivity to activation-induced cell death. EMBO J. 2005;24:4279–4290. doi: 10.1038/sj.emboj.7600894. - DOI - PMC - PubMed

Publication types

Substances

LinkOut - more resources