. 2009 Oct;69(4):333-45.
doi: 10.1007/s00239-009-9282-x. Epub 2009 Sep 29.

Using non-homogeneous models of nucleotide substitution to identify host shift events: application to the origin of the 1918 'Spanish' influenza pandemic virus

Affiliations

Using non-homogeneous models of nucleotide substitution to identify host shift events: application to the origin of the 1918 'Spanish' influenza pandemic virus

Mario dos Reis et al. J Mol Evol. 2009 Oct.

Abstract

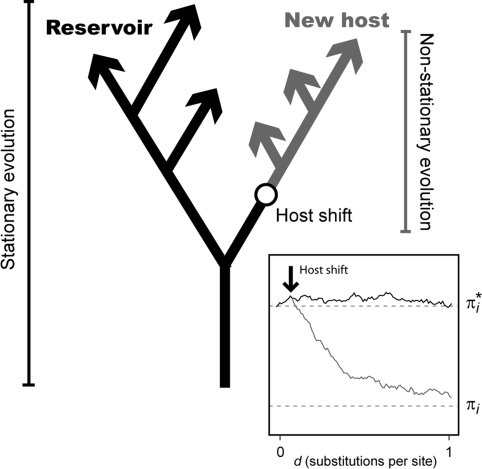
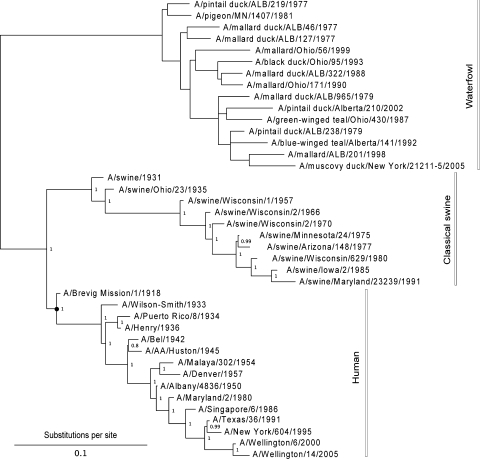
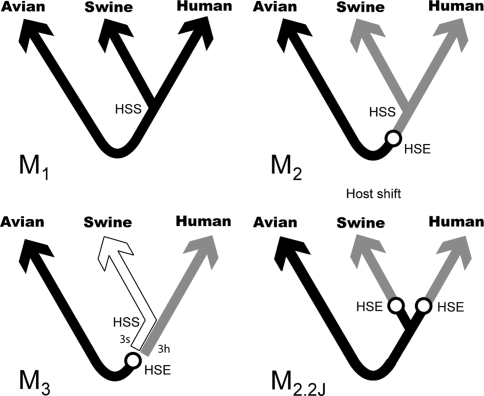
Nonhomogeneous Markov models of nucleotide substitution have received scant attention. Here we explore the possibility of using nonhomogeneous models to identify host shift nodes along phylogenetic trees of pathogens evolving in different hosts. It has been noticed that influenza viruses show marked differences in nucleotide composition in human and avian hosts. We take advantage of this fact to identify the host shift event that led to the 1918 'Spanish' influenza. This disease killed over 50 million people worldwide, ranking it as the deadliest pandemic in recorded history. Our model suggests that the eight RNA segments which eventually became the 1918 viral genome were introduced into a mammalian host around 1882-1913. The viruses later diverged into the classical swine and human H1N1 influenza lineages around 1913-1915. The last common ancestor of human strains dates from February 1917 to April 1918. Because pigs are more readily infected with avian influenza viruses than humans, it would seem that they were the original recipient of the virus. This would suggest that the virus was introduced into humans sometime between 1913 and 1918.


Figures

Fig. 1
Fig. 1
The hypothetical evolution of a virus after a cross species jump (host shift). Evolution along the new host branches is non-stationary. The inset figure shows a computer simulation of the frequency of an arbitrary nucleotide i along evolutionary time (d) after a host shift. The equilibrium frequency in the reservoir host is π i* and in the new host is πi
Fig. 2
Fig. 2
Genome G + C content versus isolation year for influenza viruses. Black dots A/H1N1 waterfowl. Red dots A/H1N1 human. The empty dots are human viruses that reappeared after 1977, the isolation time for these viruses has been corrected for the period of evolutionary stasis (see text). Blue dots A/H1N1 classical swine. Gray dots A/H5N1 human. These are avian-like sequences that have not spread within the human population, and thus retain the avian nucleotide content. Green dots Influenza B. These viruses mainly infect humans, and they may have evolved from an avian reservoir at an unknown remote date (Gammelin et al. 1990). (Color figure online)
Fig. 3
Fig. 3
Consensus tree for 1,000 bootstrap replicates. Support values for the mammalian virus clades are shown. The avian viruses are mostly from waterfowl except for a pigeon isolate. Estimating the tree under a Bayesian framework (MrBayes v3.1; Huelsenbeck et al. 2001) leads to essentially the same results. The tree is shown rooted for illustrative purposes only. The black dot indicates the position of the most recent common ancestor of the human clade (MRCAH)
Fig. 4
Fig. 4
Non-homogeneous models of influenza evolution. All model trees are unrooted. The real root is assumed to lie somewhere along the avian branches, however, its position is irrelevant since stationary evolution of the virus in the avian host is being assumed. Model M1 is homogeneous and the host shift event (HSE) cannot be determined. In models M2 and M3 the HSE is assigned avian equilibrium frequencies. Different shadings indicate that different rate matrices (equilibrium nucleotide frequencies) are used to describe evolution along the corresponding branches. With current data it is not possible to distinguish whether the HSE was avian to human, or avian to swine, so model M3 is in reality two models according to whether the branch linking the human–swine split (HSS) and the HSE is assigned human (M3h) or swine (M3s) equilibrium frequencies. Model M2.2J assumes two independent host shifts bird to mammal (see text)
Fig. 5
Fig. 5
Stability of the maximum likelihood estimates of branch lengths for model M2. The plot shows the log-likelihood profiles (top) and bootstrap sample estimates (bottom) for selected pairwise branch comparisons. The inset tree, is the tree optimized under the HKY85 M2 model, showing the waterfowl (Wf), human (Hu), and swine (Sw) clades, the host shift event (HSE) and the human–swine split (HSS). The two branches protruding from host shift event are d wf and d ma, and the two branches protruding forward from the human–swine split are d sw and d hu
Fig. 6
Fig. 6
Branch length versus year of isolation for human and swine H1N1 viruses. The total branch length from each tip to the human–swine split is plotted against the isolation year. Red dots human, blue dots classical swine. The empty dots show the corrected ages for the human viruses that reappeared in 1977. The regression slope is the approximated substitution rate. Some of the human viruses isolated between 1933 and 1957 deviate from the regression line due to extensive lab passing. The effect is negligible for the early swine viruses (1931–1957). (Color figure online)
Fig. 7
Fig. 7
Bootstrap distribution of the branches projecting from the host shift node (d ma and d wf) for the HA gene. Both branch parameters are highly correlated, making the estimation of the age of the HA gene in mammals unreliable

References

    1. Akaike H. A new look at the statistical model identification. IEEE Trans Autom Control. 1974;19:716–723. doi: 10.1109/TAC.1974.1100705. - DOI
    1. Antonovics J, Hood ME, Baker CH. Molecular virology: was the 1918 flu avian in origin? Nature. 2006;440:E9. doi: 10.1038/nature04824. - DOI - PubMed
    1. Barry D, Hartigan JA. Statistical analysis of hominoid molecular evolution. Stat Sci. 1987;2:191–210. doi: 10.1214/ss/1177013353. - DOI
    1. Blanquart S, Lartillot N. A site- and time-heterogeneous model of amino acid replacement. Mol Biol Evol. 2008;25:842–858. doi: 10.1093/molbev/msn018. - DOI - PubMed
    1. Boussau B, Blanquart S, Necsulea A, Lartillot N, Gouy M. Parallel adaptations to high temperatures in the Archaean eon. Nature. 2008;456:942–945. doi: 10.1038/nature07393. - DOI - PubMed

Publication types