. 2009 Oct 21;131(41):14844-9.
doi: 10.1021/ja9042356.

Single molecule nanocontainers made porous using a bacterial toxin

Affiliations
Free PMC article

Single molecule nanocontainers made porous using a bacterial toxin

Burak Okumus et al. J Am Chem Soc. .
Free PMC article

Abstract

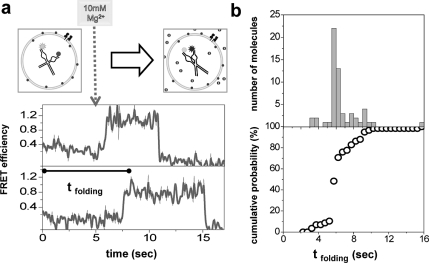
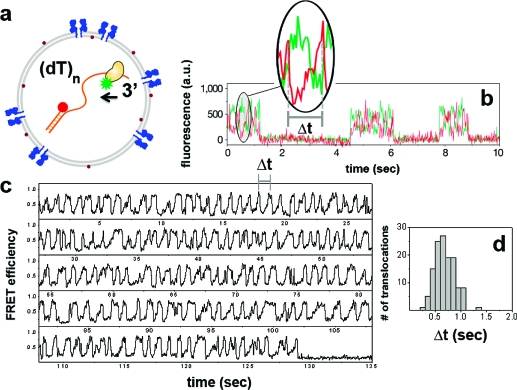
Encapsulation of a biological molecule or a molecular complex in a vesicle provides a means of biofriendly immobilization for single molecule studies and further enables new types of analysis if the vesicles are permeable. We previously reported on using DMPC (dimyristoylphosphatidylcholine) vesicles for realizing porous bioreactors. Here, we describe a different strategy for making porous vesicles using a bacterial pore-forming toxin, alpha-hemolysin. Using RNA folding as a test case, we demonstrate that protein-based pores can allow exchange of magnesium ions through the vesicle wall while keeping the RNA molecule inside. Flow measurements indicate that the encapsulated RNA molecules rapidly respond to the change in the outside buffer condition. The approach was further tested by coencapsulating a helicase protein and its single-stranded DNA track. The DNA translocation activity of E. coli Rep helicase inside vesicles was fueled by ATP provided outside the vesicle, and a dramatically higher number of translocation cycles could be observed due to the minuscule vesicle volume that facilitates rapid rebinding after dissociation. These pores are known to be stable over a wide range of experimental conditions, especially at various temperatures, which is not possible with the previous method using DMPC vesicles. Moreover, engineered mutants of the utilized toxin can potentially be exploited in the future applications.


Figures

Figure 1
Figure 1
A diagram summarizing the experimental scheme (not to scale). (Left) A home-built prism-type total internal reflection microscope with two-color fluorescence detection. (Right) The encapsulation assay. A supported lipid bilayer (a single membrane layer is depicted as one gray stripe) is first formed on a quartz coverslide (yellow) as a cushion. SUVs are then immobilized on the lipid cushion through biotin (brown dots)−streptavidin or neutravidin (blue) linker. The aHL pores on the SUV are shown also in blue. Encapsulated inside SUVs is the biomolecule (orange), depicted in folded and unfolded conformations at two and eight o’clock positions, respectively. The molecule is labeled with a donor (green) and an acceptor (red) which serve as FRET probes. The star shape represents the brighter fluorophore. Black circles represent the chemical agent (e.g., Mg2+ or ATP) relevant to the reaction under study.
Figure 2
Figure 2
(Right) A cartoon summarizing the hairpin ribozyme behavior, where the ribozyme is shown in unfolded (top) and folded (bottom) conformations. Donor and acceptor dyes are depicted in light and dark gray, respectively. (Left) FRET efficiency histograms of single encapsulated hairpin ribozymes. Mg2+ concentrations in the imaging buffer are displayed on each histogram. Not all of the assayed concentrations are shown. (Top) Ribozyme encapsulated in 0.5 mM Mg2+, measured with no Mg2+ outside SUV in the absence of aHL. Regardless of the outside imaging conditions, encapsulated ribozyme exhibited spontaneous fluctuations between folded and unfolded states,(12) which is a typical behavior for 0.5 mM Mg2+. The resultant histogram is hence a superposition of Gaussian distributions peaked around high and low FRET values, in addition to a peak at zero FRET due to the donor-only species. (Middle) Ribozyme encapsulated in 0.5 mM Mg2+, measured with no Mg2+ outside with aHL incorporated. Ribozyme remains stably unfolded. (Bottom) Ribozyme encapsulated in 0.5 mM Mg2+, measured with 0.5 mM Mg2+ subsequent to the measurement described in the middle panel. Ribozyme responds to the change in the outside buffer conditions thanks to the pores.
Figure 3
Figure 3
(a) At t = 0, ribozymes encapsulated in porous SUVs are subject to no Mg2+, hence stay unfolded (low FRET). Upon injection of 10 mM Mg2+ into the sample chamber (between fifth and sixth seconds after data acquisition, marked with a dashed arrow), ribozymes rapidly fold (transition to high FRET). The duration for the FRET value to reach ∼0.8 from t = 0 is defined as time of folding (tfolding). The top and the bottom graphs belong to different SUVs (hence different ribozymes) from the same run (thin, black line: raw data; thick, gray line: B-spline smoothed data). (b) Histogram for times of folding (top) and corresponding percentile cumulative folding probability vs time (bottom) obtained from individual traces.
Figure 4
Figure 4
(a) Rep helicase labeled with donor, and DNA labeled with acceptor at the junction depicted as coencapsulated within a porous SUV. Partial duplex DNA is an 18bp double strand carrying a (dT)80 tail. (b) Rep shuttling data obtained from surface-tethered DNA (modified from ref (32)) with a same length tail. Inset shows a single translocation event where the gradual increase in the acceptor signal (with accompanying decrease in the donor signal) reflects translocation of Rep toward the junction, whereas the abrupt drop marks the snapping back to the 3′ end. The translocation time (Δt) is defined as the period between consecutive snapping events. Individual cycles of shuttling separated in time are due to different Rep molecules from solution binding on the same surface-attached DNA and exhibiting limited repetitive translocations until dissociation. (c) FRET trace of Rep shuttling on a (dT)80 DNA within 100 nm diameter porous SUVs. In marked contrast to the surface experiments, a single Rep−DNA pair shows over 140 translocation events until acceptor photobleaching near 130 s). Time resolution was 30 ms. (d) Δt histograms can be built from a single Rep−DNA pair. Similar statistics for surface measurements (b) can only be obtained by merging data from translocations events from many shuttling cycles exhibited by different Rep molecules.

References

    1. Joo C.; McKinney S. A.; Nakamura M.; Rasnik I.; Myong S.; Ha T. Cell 2006, 126, 515–27. - PubMed
    1. Joo C.; Balci H.; Ishitsuka Y.; Buranachai C.; Ha T. Annu. Rev. Biochem. 2008, 77, 51–76. - PubMed
    1. Moerner W. E. Proc. Natl. Acad. Sci. U.S.A. 2007, 104, 12596–602. - PMC - PubMed
    1. Xie X. S.; Choi P. J.; Li G. W.; Lee N. K.; Lia G. Annu. Rev. Biophys. 2008, 37, 417–44. - PubMed
    1. Yildiz A.; Forkey J. N.; McKinney S. A.; Ha T.; Goldman Y. E.; Selvin P. R. Science 2003, 300, 2061–5. - PubMed

Publication types

LinkOut - more resources