Review
. 2010 Feb;29(1):13-7.
doi: 10.1016/j.clnu.2009.09.001. Epub 2009 Sep 27.

Protein and energy metabolism in type 1 diabetes

Affiliations
Review

Protein and energy metabolism in type 1 diabetes

Sadie L Hebert et al. Clin Nutr. 2010 Feb.

Abstract

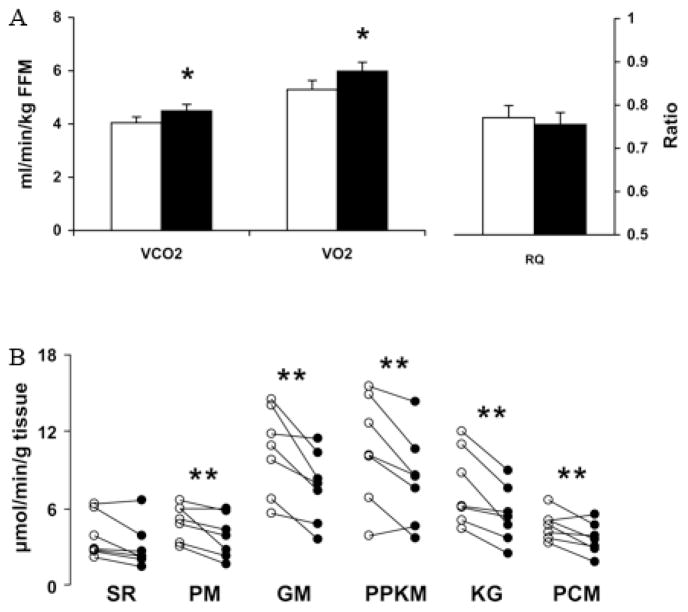
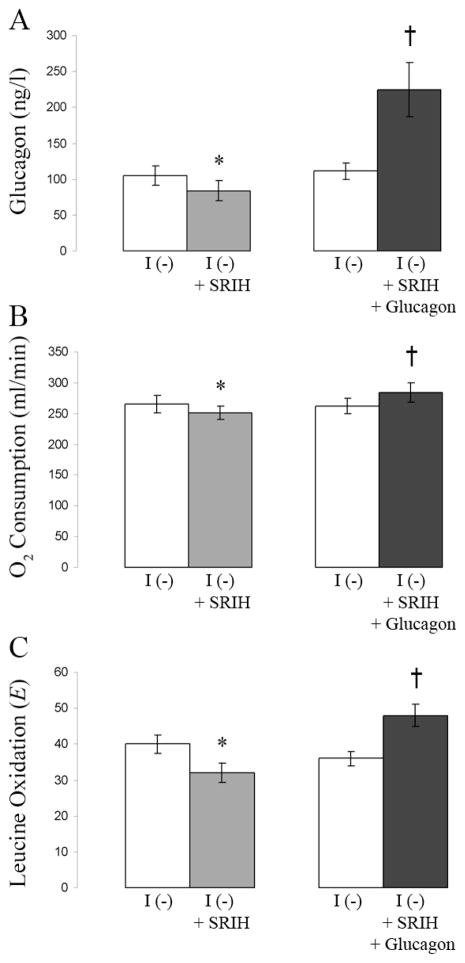
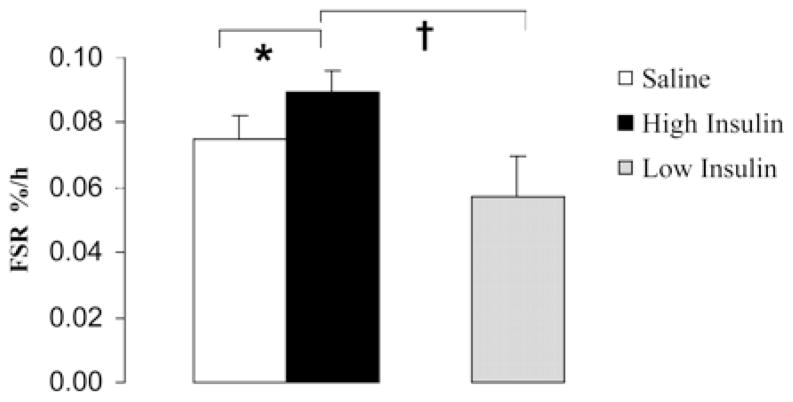
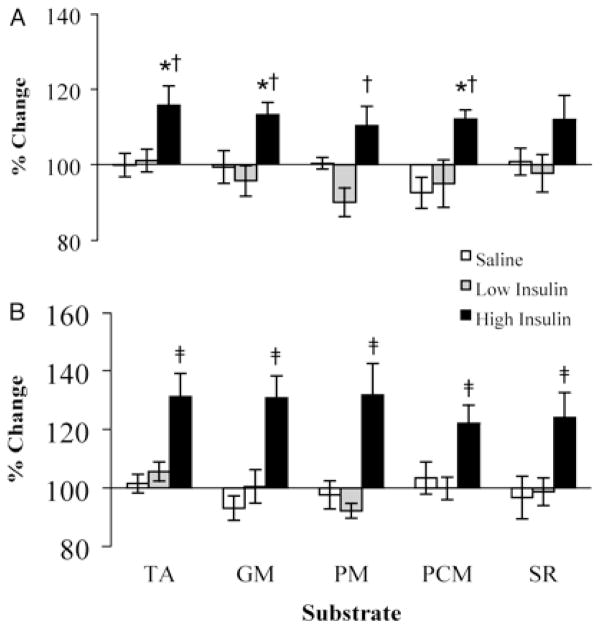
Profound metabolic changes occur in people with type 1 diabetes mellitus during insulin deprivation. These include an increase in basal energy expenditure and reduced mitochondrial function. In addition, protein metabolism is significantly affected during insulin deprivation. A greater increase in whole-body protein breakdown than protein synthesis occurs resulting in a net protein loss. During insulin deprivation the splanchnic bed has a net protein accretion which accounts for the total increase in whole-body protein synthesis while muscle is in a net catabolic state.


Conflict of interest statement

Conflict of Interest

The authors have no conflicts of interest to report.

Figures

Figure 1
Figure 1
Indirect calorimetry and muscle mitochondrial ATP production rate (MAPR) in type 1 diabetic people. A, Whole-body Vco2 and Vo2 during rest (n = 8) were significantly higher in type 1 diabetic people during insulin deprivation (I−, ■) compared with insulin treatment (I+, □). There was no difference in respiratory quotient (RQ). *P < 0.05 B, MAPR (n = 7) was significantly lower in type 1 diabetic people during insulin deprivation (I−, ●) compared with insulin treatment (I+, ○) using pyruvate plus malate (PM), glutamate plus malate (GM), pyruvate plus palmitoyl-L-carnitine plus α-ketoglutarate plus malate (PPKM), α-ketoglutarate plus glutamate (KG), and palmitoyl-L-carnitine plus one malate (PCM). There was no significant difference with succinate plus rotenone (SR). **P < 0.02 Taken with permission from Karakelides et al., 2007 Diabetes 56(11):2683–9.
Figure 2
Figure 2
High glucagon levels increase O2 consumption and leucine oxidation. The same 6 type 1 diabetic people were used in two separate studies. Baseline measurements were taken in each study during insulin deprivation (I (−)). In one study, only somatostatin was infused during insulin deprivation (I (−) + SRIH). In a separate study, somatostatin and high levels of glucagon were infused during insulin deprivation (I (−) + SRIH + Glucagon). Data are means ± SE. Values for glucagon (A), O2 consumption (B), and leucine oxidation (C) are shown. *A value significantly lower than during the baseline period; †a value significantly higher than that obtained during the baseline period. Taken with permission from data in Charlton and Nair, 1998 Diabetes 47(11):1748.
Figure 3
Figure 3
Skeletal muscle mitochondrial protein fractional synthesis rates (FSR). Mitochondrial FSR in healthy people during saline and high-dose insulin treatment. FSR during low-dose insulin infusion in a separate group of healthy people is also shown. Low-dose or high-dose insulin was infused while clamping glucose, amino acids, glucagon, and growth hormone. Values are means ± SEM. *, Significantly different from the saline value (P < 0.05); †, significantly different from the low insulin value (P < 0.05). Taken with permission from Stump et al., 2003 PNAS 100(13):7996–8001. Copyright (2003) National Academy of Sciences, U.S.A.
Figure 4
Figure 4
Muscle MAPR in healthy people during insulin infusion. Vastus lateralis muscle mitochondrial ATP production rates after 4 h (A) and 8 h (B) of saline, low-dose insulin, and high-dose insulin infusion in healthy people. Low-dose or high-dose insulin was infused while clamping glucose, amino acids, glucagon, and growth hormone. Values are expressed as a percentage of preinfusion baseline (means ± SEM). Measurements were made in the presence of five different substrate combinations: N, N, N′, N′ – tetramethyl-p-phenylenediamine plus ascorbate (TA), glutamate plus malate (GM), pyruvate plus malate (PM), palmitoyl-L-carnitine plus malate (PCM), or succinate plus rotenone (SR). *, Significantly different (P < 0.05) from the saline values; †, significantly different from the low insulin values at 4 h (P < 0.05); ‡, significant difference from the saline values and low insulin values at 8 h (P < 0.01). Taken with permission from Stump et al., 2003 PNAS 100(13):7996–8001. Copyright (2003) National Academy of Sciences, U.S.A.

References

    1. Charlton MR, Nair KS. Role of hyperglucagonemia in catabolism associated with type 1 diabetes: effects on leucine metabolism and the resting metabolic rate. Diabetes. 1998;47(11):1748–56. - PubMed
    1. Karakelides H, Asmann YW, Bigelow ML, Short KR, Dhatariya K, Coenen-Schimke J, Kahl J, Mukhopadhyay D, Nair KS. Effect of insulin deprivation on muscle mitochondrial ATP production and gene transcript levels in type 1 diabetic subjects. Diabetes. 2007;56(11):2683–9. - PubMed
    1. Nair KS, Halliday D, Garrow JS. Increased energy expenditure in poorly controlled Type 1 (insulin-dependent) diabetic patients. Diabetologia. 1984;27(1):13–6. - PubMed
    1. Chhibber VL, Soriano C, Tayek JA. Effects of low-dose and high-dose glucagon on glucose production and gluconeogenesis in humans. Metabolism. 2000;49(1):39–46. - PubMed
    1. Nair KS. Hyperglucagonemia increases resting metabolic rate in man during insulin deficiency. J Clin Endocrinol Metab. 1987;64(5):896–901. - PubMed

Publication types