. 2009 Sep;21(9):2884-97.
doi: 10.1105/tpc.109.067678. Epub 2009 Sep 29.

MAP kinase phosphatase1 and protein tyrosine phosphatase1 are repressors of salicylic acid synthesis and SNC1-mediated responses in Arabidopsis

Affiliations

MAP kinase phosphatase1 and protein tyrosine phosphatase1 are repressors of salicylic acid synthesis and SNC1-mediated responses in Arabidopsis

Sebastian Bartels et al. Plant Cell. 2009 Sep.

Abstract

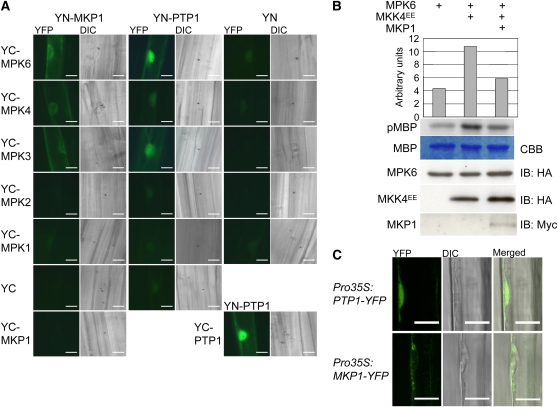
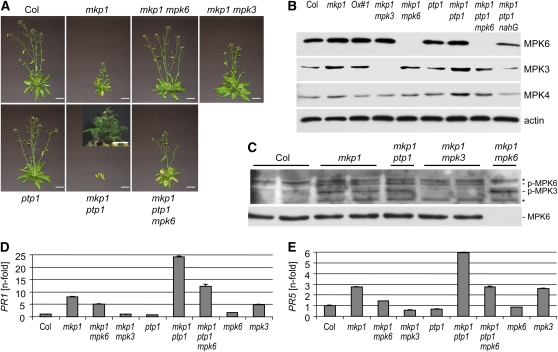
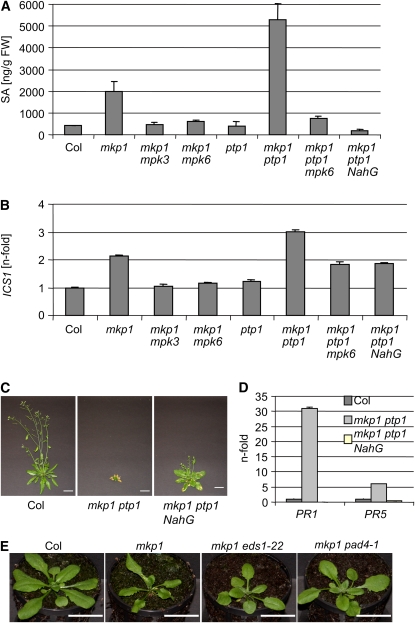
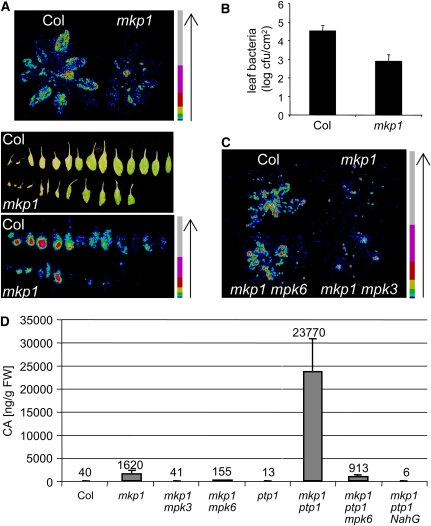
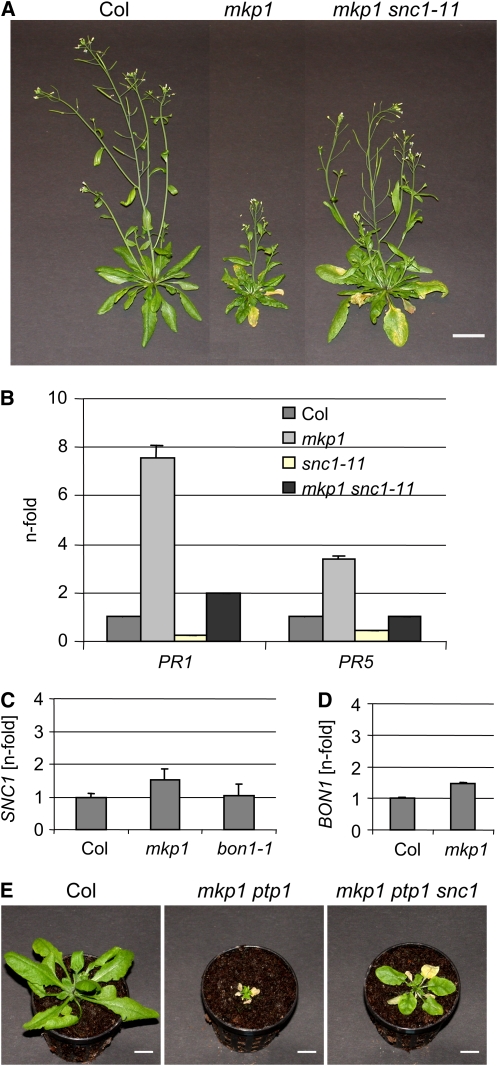
Mitogen-activated protein (MAP) kinase phosphatases are important negative regulators of the levels and kinetics of MAP kinase activation that modulate cellular responses. The dual-specificity phosphatase MAP KINASE PHOSPHATASE1 (MKP1) was previously shown to regulate MAP KINASE6 (MPK6) activation levels and abiotic stress responses in Arabidopsis thaliana. Here, we report that the mkp1 null mutation in the Columbia (Col) accession results in growth defects and constitutive biotic defense responses, including elevated levels of salicylic acid, camalexin, PR gene expression, and resistance to the bacterial pathogen Pseudomonas syringae. PROTEIN TYROSINE PHOSPHATASE1 (PTP1) also interacts with MPK6, but the ptp1 null mutant shows no aberrant growth phenotype. However, the pronounced constitutive defense response of the mkp1 ptp1 double mutant reveals that MKP1 and PTP1 repress defense responses in a coordinated fashion. Moreover, mutations in MPK3 and MPK6 distinctly suppress mkp1 and mkp1 ptp1 phenotypes, indicating that MKP1 and PTP1 act as repressors of inappropriate MPK3/MPK6-dependent stress signaling. Finally, we provide evidence that the natural modifier of mkp1 in Col is largely the disease resistance gene homolog SUPPRESSOR OF npr1-1, CONSTITUTIVE 1 (SNC1) that is absent in the Wassilewskija accession. Our data thus indicate a major role of MKP1 and PTP1 in repressing salicylic acid biosynthesis in the autoimmune-like response caused by SNC1.


Figures

Figure 1.
Figure 1.
MKP1 and PTP1 Interact with and Deactivate MPK6, but Differ in Their Subcellular Localization. (A) BiFC visualization of interactions in transiently transformed mustard hypocotyl cells. YFP signal indicates reconstitution through direct interaction of the tested protein partners. Combinations with YN and YC designate the empty vector controls; YC-MPK1 and YC-MPK2 are shown as negative controls indicating specificity of the detected interactions. The corresponding differential interference contrast (DIC) image is shown for each fluorescence image. Bars = 20 μm. (B) Arabidopsis protoplasts were transiently transformed with the indicated combinations of HA-MPK6, HA-MKK4EE (constitutively active form), and myc-MKP1, all expressed under the control of the 35S constitutive promoter. Respective MPK6 activities were determined by phosphorylation of the artificial substrate myelin basic protein (MBP) as shown by autoradiography (pMBP) and the corresponding quantification. The MBP panel shows Coomassie blue (CBB) stained loading. Levels of HA-MPK6, HA-MKK4EE, and myc-MKP1 were determined by immunoblot (IB) analysis. A representative experiment out of three comparable repetitions is shown. (C) MKP1-YFP localizes mainly to the cytoplasm and PTP1-YFP to both the nucleus and cytoplasm. YFP fluorescence in root cells of Arabidopsis seedlings stably expressing cauliflower mosaic virus 35S promoter-driven MKP1-YFP and PTP-YFP fusion constructs as detected with a LSM 510 confocal laser scanning microscope (Zeiss). Bars = 10 μm.
Figure 2.
Figure 2.
MKP1 and PTP1 Act Redundantly to Regulate Growth Homeostasis and PR Gene Expression in an MPK3- and MPK6-Dependent Manner. (A) Photographs of 40-d-old plants grown on soil under standard conditions are shown. Aberrant phenotypes of mkp1(Col) and mkp1 ptp1 are suppressed by mpk3 and mpk6 mutations. Bars = 2 cm. Small inset to mkp1 ptp1 shows a close-up of a different plant with the same genotype (bar = 0.5 cm). (B) Immunoblot analysis of MPK3, MPK4, MPK6, and actin (loading control) protein levels in 22-d-old soil-grown plants. (C) MPK3 and MPK6 activation profile in 22-d-old soil grown plants as detected by immunoblotting using anti-phospho-p44/42 MAP kinase antibodies (p-MPK6 and p-MPK3). The immunoblot was reprobed with anti-MPK6 antibody. Two samples from independent biological repetitions were loaded for Col, mkp1, and mkp1 mpk3. (D) and (E) Quantitative RT-PCR analysis of PR1 (D) and PR5 (E) expression levels in 22-d-old plants compared with wild-type Col. A representative experiment out of three independent biological repetitions is shown. Error bars represent sd of the technical triplicates.
Figure 3.
Figure 3.
SA Accumulation Is Largely Responsible for the Aberrant mkp1(Col) and mkp1 ptp1 Phenotypes. (A) Total SA levels of 22-d-old soil-grown plants, as determined by HPLC. The average of three independent biological samples is shown for each genotype. Error bars represent sd. (B) Quantitative RT-PCR analysis of ICS1 expression levels. Representative data of three biological replicates are shown. Error bars represent sd of the technical triplicates. (C) Photographs of 40-d-old soil-grown plants showing that expression of NahG largely suppresses the mkp1 ptp1 growth phenotype (note that the Col and mkp1 ptp1 photographs are identical to those shown in Figure 2A; all photographs were taken in parallel, under identical conditions). Bars = 2 cm. (D) Quantitative RT-PCR analysis of PR1 and PR5 expression levels in 22-d-old mkp1 ptp1 and mkp1 ptp1 NahG compared with wild-type Col. Representative data of three biological replicates are shown. Error bars represent the sd of the technical triplicates. (E) Photographs of 22-d-old plants grown on soil under standard conditions showing that eds1 and pad4 mutations suppress the mkp1 growth phenotype. Bars = 2 cm. [See online article for color version of this figure.]
Figure 4.
Figure 4.
mkp1(Col) Has Increased Resistance to P. syringae Infection and Constitutively Accumulates Elevated Levels of Camalexin. (A) Bioluminescence representing bacterial growth on rosettes and detached leaves 1 and 4 d, respectively, after spray inoculation with P. syringae pv tomato DC3000 strain carrying the luxCDABE operon. Color scale bars are shown; arrows indicate increasing photon intensity. Cold colors (e.g., blue and green) represent regions of lower photon counts, and warm colors (e.g., yellow and red) represent regions of more intense luminescence. (B) Leaf bacteria as determined by serial dilution plating 4 days postinoculation. The means ± se (n = 10) are shown. The difference between Col and mkp1(Col) is statistically significant (Student's t test, P < 0.001). Representative data of three independent biological repetitions are shown in (A) and (B). (C) Bioluminescence representing bacterial growth on plants 3 d after spray inoculation with Pst DC3000 lux. Representative data of two independent repetitions is shown. (D) Camalexin levels in 22-d-old plants. The average level of three independent samples is shown. Error bars represent sd.
Figure 5.
Figure 5.
SNC1 Is a Natural Modifier of mkp1. (A) Photographs of 40-d-old soil-grown plants showing that snc1 largely suppresses the mkp1 growth phenotype (note that the Col and mkp1 photographs are identical to those shown in Figure 2A; all photographs were taken in parallel, under identical conditions). Bars = 2 cm. (B) to (D) Quantitative RT-PCR analysis of PR1 and PR5 (B), BON1 (C), and SNC1 (D) gene expression. Representative data of three independent experiments are shown. Error bars represent the sd of the technical triplicates. (E) Photographs of 34-d-old soil-grown plants showing that snc1 partially suppresses the mkp1 ptp1 growth phenotype. Bars = 1 cm. [See online article for color version of this figure.]

Comment in

References

    1. Alcazar, R., Garcia, A.V., Parker, J.E., and Reymond, M. (2009). Incremental steps toward incompatibility revealed by Arabidopsis epistatic interactions modulating salicylic acid pathway activation. Proc. Natl. Acad. Sci. USA 106 334–339. - PMC - PubMed
    1. Alonso, J.M., et al. (2003). Genome-wide insertional mutagenesis of Arabidopsis thaliana. Science 301 653–657. - PubMed
    1. Asai, T., Tena, G., Plotnikova, J., Willmann, M.R., Chiu, W.L., Gomez-Gomez, L., Boller, T., Ausubel, F.M., and Sheen, J. (2002). MAP kinase signalling cascade in Arabidopsis innate immunity. Nature 415 977–983. - PubMed
    1. Beckers, G.J., Jaskiewicz, M., Liu, Y., Underwood, W.R., He, S.Y., Zhang, S., and Conrath, U. (2009). Mitogen-activated protein kinases 3 and 6 are required for full priming of stress responses in Arabidopsis thaliana. Plant Cell 21 944–953. - PMC - PubMed
    1. Bomblies, K., Lempe, J., Epple, P., Warthmann, N., Lanz, C., Dangl, J.L., and Weigel, D. (2007). Autoimmune response as a mechanism for a Dobzhansky-Muller-type incompatibility syndrome in plants. PLoS Biol. 5 e236. - PMC - PubMed

Publication types

MeSH terms