. 2009 Oct 1;15(19):6113-27.
doi: 10.1158/1078-0432.CCR-09-1087. Epub 2009 Sep 29.

Antiglioma immunological memory in response to conditional cytotoxic/immune-stimulatory gene therapy: humoral and cellular immunity lead to tumor regression

Affiliations

Antiglioma immunological memory in response to conditional cytotoxic/immune-stimulatory gene therapy: humoral and cellular immunity lead to tumor regression

A K M Ghulam Muhammad et al. Clin Cancer Res. .

Abstract

Purpose: Glioblastoma multiforme is a deadly primary brain cancer. Because the tumor kills due to recurrences, we tested the hypothesis that a new treatment would lead to immunological memory in a rat model of recurrent glioblastoma multiforme.

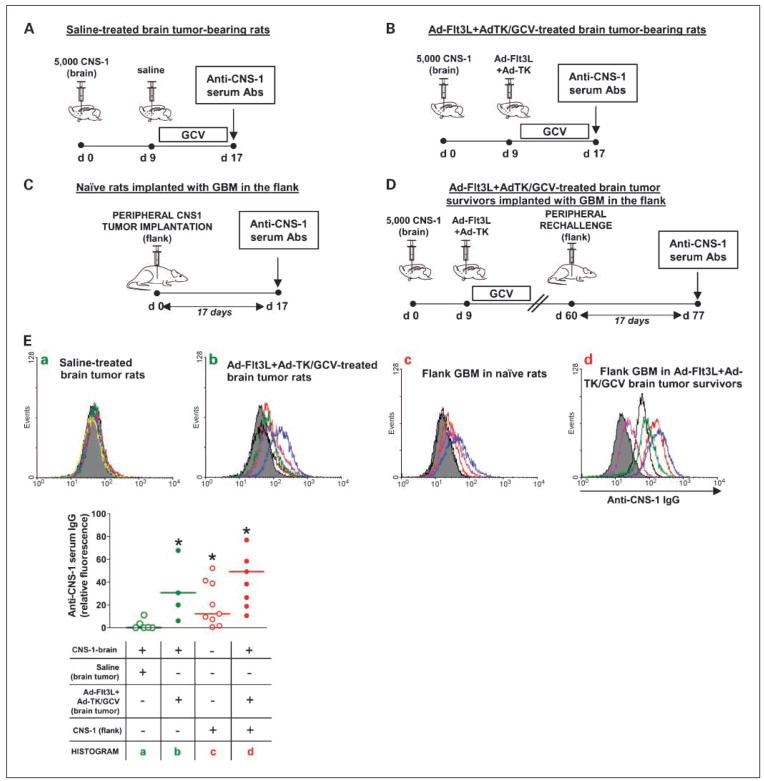
Experimental design: We developed a combined treatment using an adenovirus (Ad) expressing fms-like tyrosine kinase-3 ligand (Flt3L), which induces the infiltration of immune cells into the tumor microenvironment, and an Ad expressing herpes simplex virus-1-thymidine kinase (TK), which kills proliferating tumor cells in the presence of ganciclovir.

Results: This treatment induced immunological memory that led to rejection of a second glioblastoma multiforme implanted in the contralateral hemisphere and of an extracranial glioblastoma multiforme implanted intradermally. Rechallenged long-term survivors exhibited anti-glioblastoma multiforme-specific T cells and displayed specific delayed-type hypersensitivity. Using depleting antibodies, we showed that rejection of the second tumor was dependent on CD8(+) T cells. Circulating anti-glioma antibodies were observed when glioblastoma multiforme cells were implanted intradermally in naïve rats or in long-term survivors. However, rats bearing intracranial glioblastoma multiforme only exhibited circulating antitumoral antibodies upon treatment with Ad-Flt3L + Ad-TK. This combined treatment induced tumor regression and release of the chromatin-binding protein high mobility group box 1 in two further intracranial glioblastoma multiforme models, that is, Fisher rats bearing intracranial 9L and F98 glioblastoma multiforme cells.

Conclusions: Treatment with Ad-Flt3L + Ad-TK triggered systemic anti-glioblastoma multiforme cellular and humoral immune responses, and anti-glioblastoma multiforme immunological memory. Release of the chromatin-binding protein high mobility group box 1 could be used as a noninvasive biomarker of therapeutic efficacy for glioblastoma multiforme. The robust treatment efficacy lends further support to its implementation in a phase I clinical trial.


Conflict of interest statement

Disclosure of Potential Conflicts of Interest

No potential conflicts of interest were disclosed.

Figures

Fig. 1
Fig. 1
Ad-Flt3L + Ad-TK elicit CD8+ T cell–dependent immunological memory against a second glioblastoma multiforme. Lewis rats received CNS-1 cell injection into the right striatum followed 9 d later by intratumoral injection of either saline or Ad-Flt3L + Ad-TK. After 24 h, they received ganciclovir (25 mg/kg i.p.) twice daily for 10 d. A, the presence of tumor antigen–specific–producing T-cell precursors in the spleen was quantified using an IFN-γ ELISPOT 7 d after the treatment. Splenocytes were challenged using extracts of glioblastoma multiforme CNS-1 cells, pancreatic carcinoma DSL6A cells, and L2 yolk sac carcinoma cells. Concanavalin A (ConA) stimulated splenocytes (+) are shown as a positive control. *, P < 0.05 versus saline-treated rats (Student’s t test). B, 60 d after primary tumor implantation, Ad-Flt3L + Ad-TK–treated survivors were rechallenged in the contralateral hemisphere with CNS-1 cells. As controls, naive rats were also implanted with intracranial CNS-1 tumors. Seven days after rechallenge, spleens were collected to detect tumor antigen–specific T-cell precursors. These were quantified using an IFN-γ ELISPOT. *, P < 0.05 versus naïve (Student’s t test). C, DTH was done in long-term survivors 120 d after rechallenge. Naïve rats that did not receive tumors were used as controls. Irradiated CNS-1 cells were injected intradermally into the pinna of the right ear, and the left pinna received saline. The thickness of the pinna was recorded with slide calipers after 4, 24, and 48 h. *, P < 0.05 versus saline ear (randomization test). D, Kaplan-Meier survival curves showing the survival of brain tumor rechallenged rats that were depleted of specific immune cell populations 24 h before the second tumor implantation. Antigen-presenting cells were depleted using clodronate-filled liposomas (n = 4). CD4+ and CD8+ cells were depleted using an anti-CD2 antibody (OX-34; n = 6) and an anti-CD8 antibody (OX-8; n = 4), respectively. *, P < 0.05 versus no depletion (Mantel log rank test). Representative dot plots show the depletion of immune cell populations in the spleen, as assayed by flow cytometry using anti–CD4-PE-Cy5 and anti–CD8-PE or anti–CD68-FITC (macrophages).
Fig. 2
Fig. 2
Extracranial glioblastoma multiforme implantation in Ad-Flt3L + Ad-TK (+ganciclovir)–treated brain tumor survivors. A, Lewis rats received 4,500 CNS-1 cell injection into the right striatum, followed 9 d later by intratumoral injection of Ad-Flt3L + Ad-TK or, as controls, saline or an empty Ad (Ad-0). After 24 h, they received ganciclovir (25 mg/kg i.p.) twice daily for 10 d. Ad-Flt3L + Ad-TK–treated rats surviving to 60 d were rechallenged with 3 million CNS-1 cells injected intradermally into the flank. Tumor growth was monitored daily. Rats were euthanized for histopathologic analysis of brain and flank tumors 17 d after glioblastoma multiforme implantation in the flank. B, Kaplan-Meyer survival curves for intracranial glioblastoma multiforme bearing rats treated 9 d after tumor implantation in the brain with saline (n = 13, open squares), empty Ad (n = 5, open circles), or Ad-Flt3L + Ad-TK (+ganciclovir; n = 11; solid circles). *, P < 0.05 versus saline (Mantel log rank test). C, flank tumor volume was determined in naïve rats or Ad-Flt3L + Ad-TK (+ganciclovir)–treated brain tumor survivors following injection of 3 million CNS-1 cells into the flank. *, P < 0.05 versus Ad-Flt3L + Ad-TK–treated brain tumor survivors (randomization test). D, levels of HMGB1 were assessed by ELISA in the serum from saline-treated rats or Ad-Flt3L + Ad-TK (+ganciclovir)–treated rats bearing intracranial CNS-1 tumor 8 d after the treatment (black dots). Ad-Flt3L + Ad-TK (+ganciclovir)–treated brain tumor survivors (~80%) were rechallenged with CNS-1 cells in the flank 60 d after the primary brain tumor implantation. As controls, naïve rats were also implanted in the flank with CNS-1 tumors. Serum was collected 17 d after glioblastoma multiforme implantation in the flank to determine the levels of HMGB1 (gray dots). *, P < 0.05 versus saline-treated rats implanted with brain tumors (empty dots), as determined by Kruskal-Wallis multiple comparison followed by Dunn’s test.
Fig. 3
Fig. 3
Histologic features of flank tumors in naïve rats. Flank tumor pathologic features were studied in paraffin-embedded sections of flank glioblastoma multiforme specimens harvested at day 17 post–tumor implantation in naïve rats. A, low-magnification image shows the macroscopic appearance and size of a representative flank tumor in naïve Lewis rat, as assessed by hematoxylin-eosin staining. High-magnification microphotographs show nuclear atypia (black arrow, top), profuse neovascularization (black arrows, center), and areas of coagulative necrosis (black arrows, bottom) and pseudopalisading (green arrows, bottom). B, trichrome staining was used to detect the presence of collagen fibers in the tissue surrounding the tumor mass (black arrows). High-magnification microphotographs show the absence of collagen tissue in the central tumor mass (top) and the abundance of collagen fibers in periphery of the tumor growing in the flank (bottom). C, representative images of flank tumor sections stained with anti-vimentin antibody. High-magnification images show positive vimentin immunoreactivity in atypical cells with large pleomorphic nuclei within the tumor mass (arrows). D, representative images of flank tumor sections stained with anti-CD68 antibody. High-magnification microphotograph show infiltration of CD68+ cells (macrophages; arrows) within the tumor mass. E, representative images of flank tumor sections stained with anti-von Willebrand Factor antibody. High-magnification microphotograph shows immunoreactivity in vascular endothelial cells (arrows).
Fig. 4
Fig. 4
Humoral immune response against intracranial (A and B) or extracranial (C and D) glioblastoma multiforme. Lewis rats were implanted intracranially with CNS-1 cells (4,500) and 9 d later received intratumoral injection of either saline (A) or Ad-Flt3L + Ad-TK (+ganciclovir; B and D). Serum was collected from saline-treated rats (A) or Ad-Flt3L + Ad-TK (+ganciclovir)–treated rats (B) 8 d after the treatment for detection of anti–CNS-1 antibodies. Ad-Flt3L + Ad-TK (+ganciclovir)–treated brain tumor survivors (~80%) were rechallenged with CNS-1 cells (3 × 10⁶) in the flank (D) 60 d after brain tumor implantation. As controls, naïve rats were also implanted in the flank with CNS-1 tumors (C). Serum was collected 17 d after glioblastoma multiforme implantation in the flank to determine the presence of anti–CNS-1 antibodies by flow cytometry. Serum from naïve rats that did not receive tumor was used as isotype control (gray histograms). The scatter plot shows the fluorescence of CNS-1 cells bound to putative opsonizing antibodies was determined by flow cytometry. The fluorescence of CNS-1 cells incubated with serum from naïve non–tumor bearing rats was subtracted from test samples. *, P < 0.05 versus saline-treated intracranial glioblastoma multiforme–bearing rats (a) as determined by Kruskal-Wallis multiple comparison, followed by Dunn’s test. Histograms show the fluorescence intensity of CNS-1 cells labeled with serum from non–tumor bearing rats (isotype control; gray histogram) or with serum from rats from each of the experimental groups (colored lines).
Fig. 5
Fig. 5
Characterization of rat orthotopic glioblastoma multiforme models. A, in vitro cell growth rates of F98, 9L, and CNS-1 rat glioblastoma multiforme cells (n = 3 wells per group). Cells (5,000) were seeded on day 0, and cells were harvested and counted every day for up to 15 d. *, P < 0.05 versus CNS-1, ^, P < 0.05 versus 9L (randomization test). B, expression of MHCI was assessed in CNS-1, 9L, and F98 cells by flow cytometry. Representative histograms show the intensity of FITC–mouse anti-rat MHCII or isotype control (FITC–mouse IgG1κ; red area). Numbers indicate the percentage of low- and high-expressing cells. C–E, in vivo tumor growth rates of intracranial F98, 9L, and CNS-1 glioblastoma multiforme in rats. Fisher rats were implanted in the striatum with F98 cells (C) or 9L cells (D), and Lewis rats were injected with CNS-1 cells (E). Brains were processed for stereology to determine tumor volume 3, 6, and 9 d after tumor implantation. Graphs show tumor growth rates for each tumor model (n = 3 per group). Doubling time and regression coefficient (R2) are indicated in the graphs. Microphotographs show the appearance of representative brain tumor sections stained with Nissl. Infiltration of inflammatory cells was detected using antibodies against CD68 (macrophages/activated microglia).
Fig. 6
Fig. 6
Efficacy of the combined Ad-TK and Ad-Flt3L gene therapy in several syngeneic intracranial rat glioblastoma multiforme models. A, Fisher rats were implanted with F98 cells and treated 7 d later with saline (n = 6), Ad-TK (n = 10), Ad-Flt3L (n = 5), or Ad-Flt3L + Ad-TK (n = 10). B, Fisher rats were implanted in the striatum with 9L cells and treated 9 d later with saline (n = 8), Ad-TK (n = 10), Ad-Flt3L (n = 5), or Ad-Flt3L + Ad-TK (n = 9). C, Lewis rats were implanted in the striatum with CNS-1 cells and treated 9 d later with saline (n = 10), Ad-TK (n = 5), Ad-Flt3L (n = 5), or Ad-Flt3L + Ad-TK (n = 8). Rats received ganciclovir (25 mg/kg i.p.) twice daily for 10 d. Graphs show Kaplan-Meier survival curves of tumor-bearing rats. *, P < 0.05 versus saline; ^, P < 0.05 versus Ad-TK (log rank test). Microphotographs show the neuropathology of moribund saline-treated rats and of Ad-Flt3L + Ad-TK–treated long-term survivors (60 d after tumor implantation). Brains were stained using Nissl, and immunocytochemistry was done using antibodies against TH and MBP. D, 5 d after the treatment, tumor-bearing rats treated with saline or Ad-Flt3L + Ad-TK were euthanized, and the circulating levels of HMGB1 were measured in serum by ELISA. *, P < 0.05 versus saline (Student’s t test).

References

    1. Chinot OL, Barrie M, Fuentes S, et al. Correlation between O6-methylguanine-DNA methyl-transferase and survival in inoperable newly diagnosed glioblastoma patients treated with neoadjuvant temozolomide. J Clin Oncol. 2007;25:1470–5. - PubMed
    1. Hegi ME, Diserens AC, Gorlia T, et al. MGMT gene silencing and benefit from temozolomide in glioblastoma. N Engl J Med. 2005;352:997–1003. - PubMed
    1. Izquierdo M, Martin V, de Felipe P, et al. Human malignant brain tumor response to herpes simplex thymidine kinase (HSVtk)/ganciclovir gene therapy. Gene Ther. 1996;3:491–5. - PubMed
    1. Klatzmann D, Valery CA, Bensimon G, et al. A phase I/II study of herpes simplex virus type 1 thymidine kinase “suicide” gene therapy for recurrent glioblastoma. Study Group on Gene Therapy for Glioblastoma. Hum Gene Ther. 1998;9:2595–604. - PubMed
    1. Rainov NG. A phase III clinical evaluation of herpes simplex virus type 1 thymidine kinase and ganciclovir gene therapy as an adjuvant to surgical resection and radiation in adults with previously untreated glioblastoma multiforme. Hum Gene Ther. 2000;11:2389–401. - PubMed

Publication types

MeSH terms