. 2009 Oct 1;69(19):7826-34.
doi: 10.1158/0008-5472.CAN-09-1564. Epub 2009 Sep 29.

Immutable functional attributes of histologic grade revealed by context-independent gene expression in primary breast cancer cells

Affiliations

Immutable functional attributes of histologic grade revealed by context-independent gene expression in primary breast cancer cells

Shanaz H Dairkee et al. Cancer Res. .

Abstract

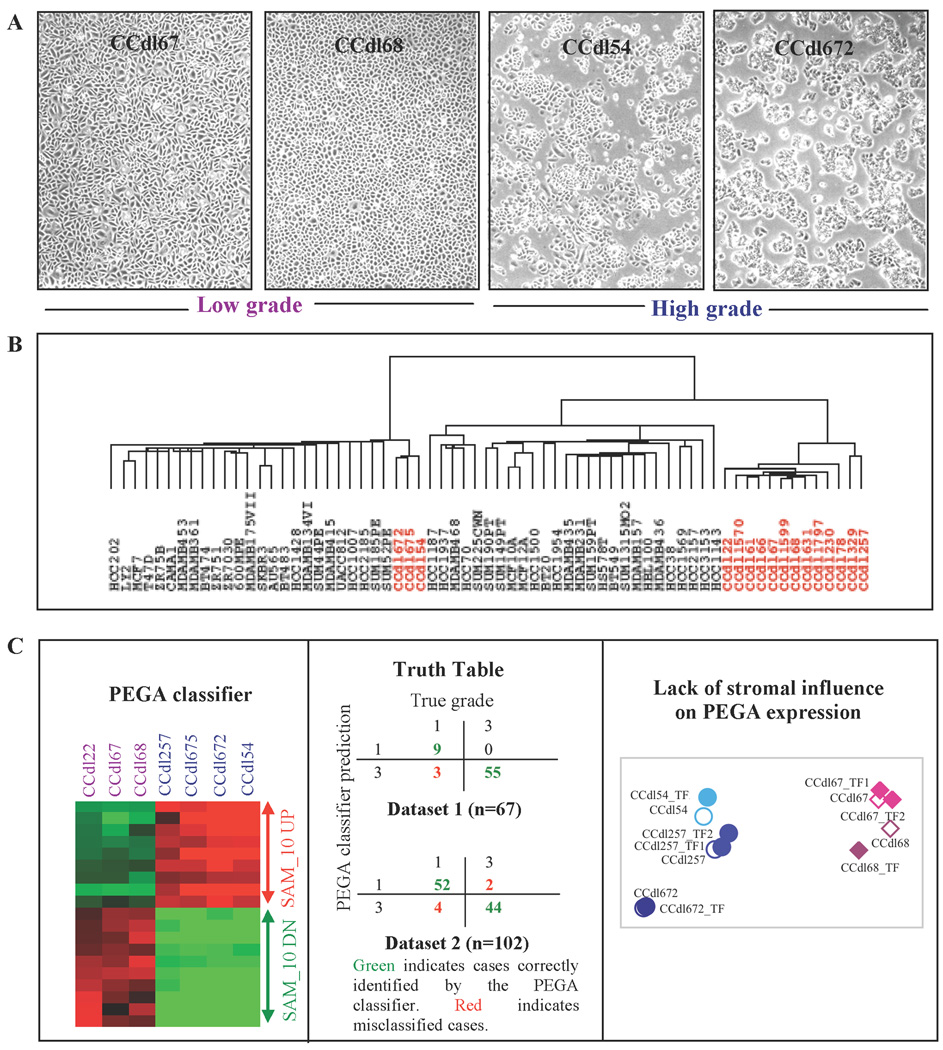
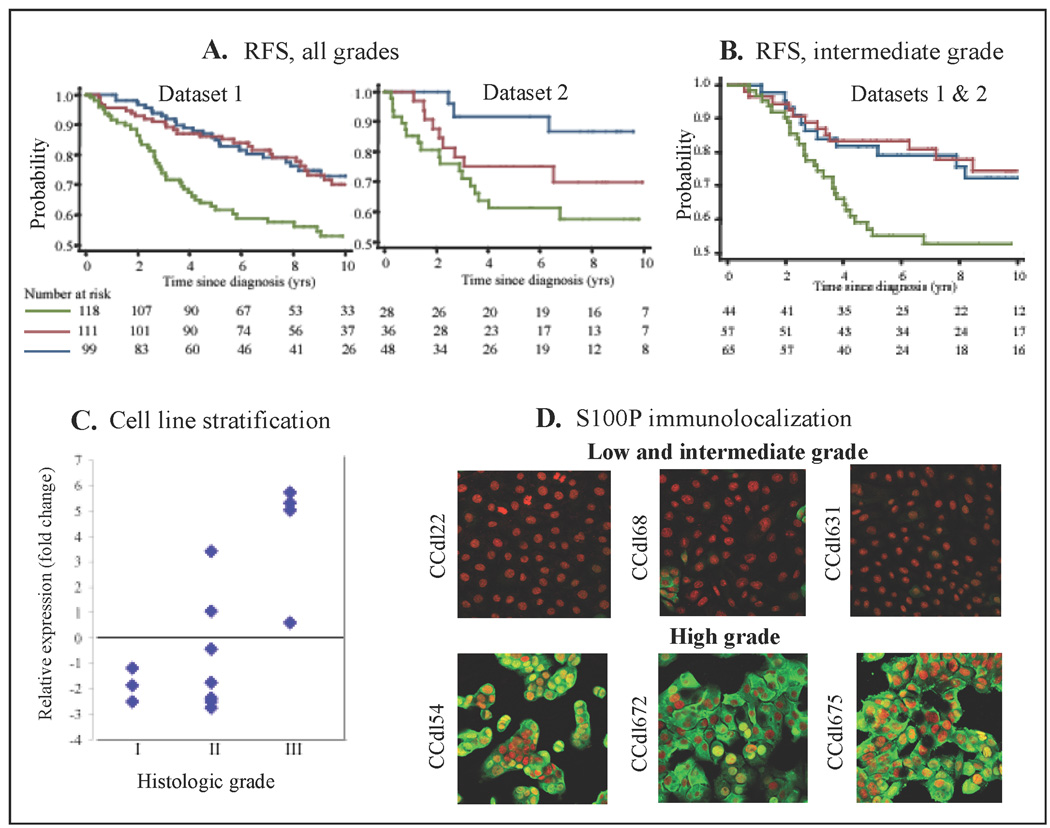
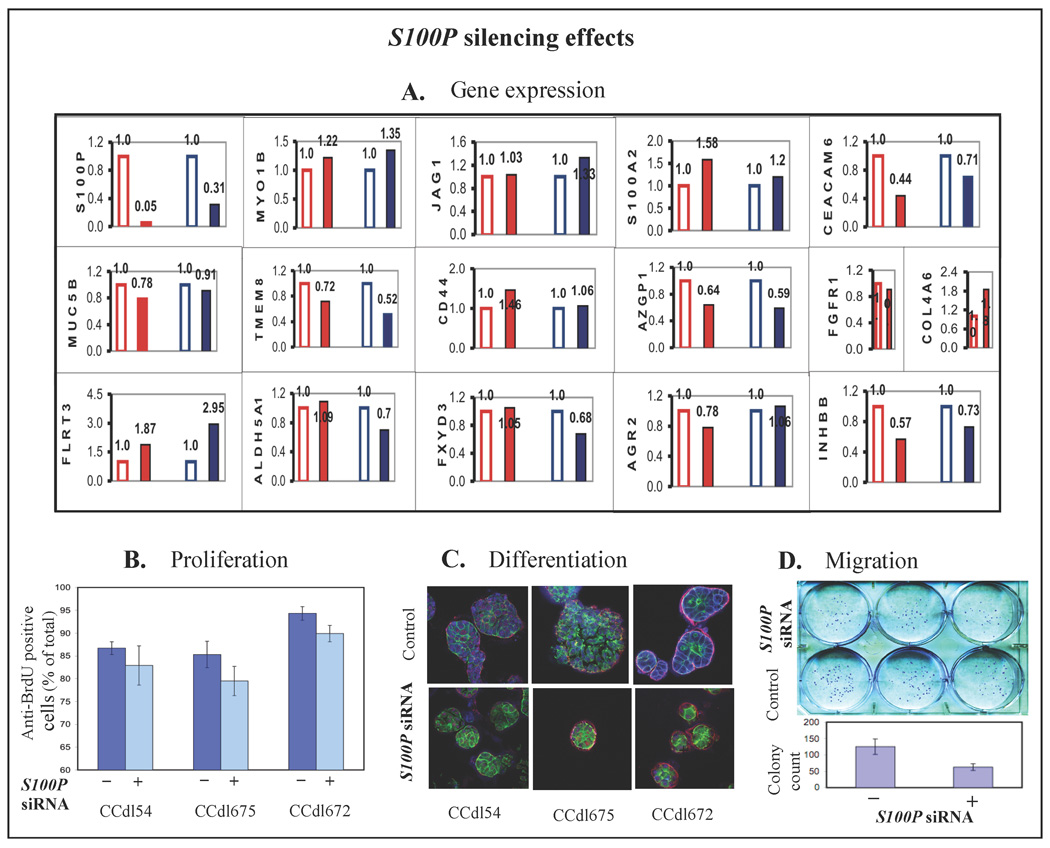
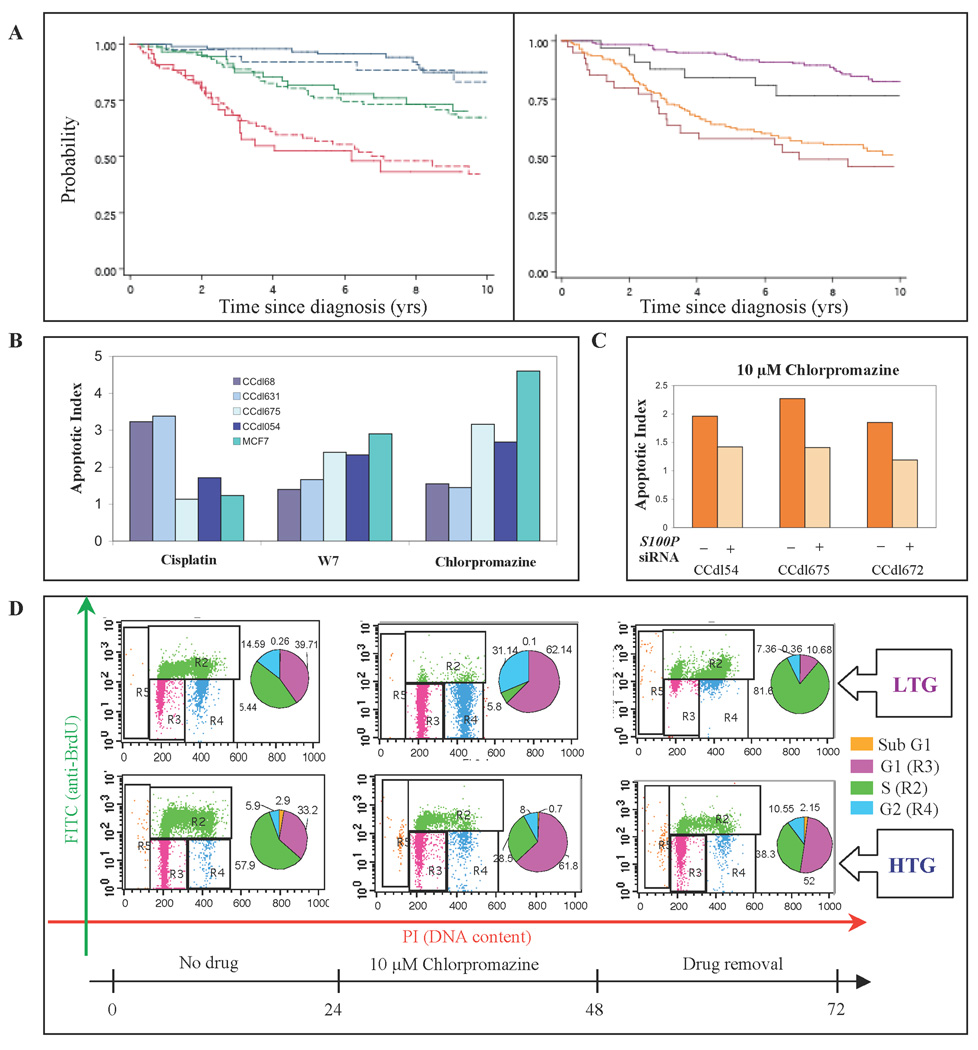
Inherent cancer phenotypes that are independent of fluctuating cross-talk with the surrounding tissue matrix are highly desirable candidates for targeting tumor cells. Our novel study design uses epithelial cell lines derived from low versus high histologic grade primary breast cancer to effectively diminish the breadth of transient variability generated within the tumor microenvironment of the host, revealing a "paracrine-independent expression of grade-associated" (PEGA) gene signature. PEGA members extended beyond "proliferation-driven" signatures commonly associated with aggressive, high-grade breast cancer. The calcium-binding protein S100P was prominent among PEGA genes overexpressed in high-grade tumors. A three-member fingerprint of S100P-correlated genes, consisting of GPRC5A, FXYD3, and PYCARD, conferred poor outcome in multiple breast cancer data sets, irrespective of estrogen receptor status but dependent on tumor size (P < 0.01). S100P silencing markedly diminished coregulated gene transcripts and reversed aggressive tumor behavior. Exposure to pathway-implicated agents, including the calmodulin inhibitor N-(6-aminohexyl)-5-chloro-1-naphthalenesulfonamide, phenothiazine, and chlorpromazine, resulted in rapid apoptotic cell death in high-grade tumor cells resistant to the chemotherapeutic drug cisplatin. This is the first comprehensive study describing molecular phenotypes intimately associated with histologic grade whose expression remains relatively fixed despite an unavoidably changing environment to which tumor cells are invariably exposed.


Figures

Figure 1
Figure 1. Distinctive profiles of proliferating primary breast tumor cells of varying histologic grade
A, Microscopic phenotype of histologic grade in four independent breast epithelial cell lines derived from low grade tumors (LTG - 2 left panels) and high grade tumors (HTG - 2 right panels). B, Hierarchical clustering of 67 independent breast epithelial cell lines based on global gene expression profiling. Sixteen novel primary tumor cell lines encompassing low, intermediate, and high histologic grade are displayed in red lettering (CCdl1797 and CCdl230 are ungraded). C - Left panel, SAM- identified, PEGA-based top 10 upregulated (UP), and downregulated (DN) probe IDs distinguish proliferating tumor cells of low grade (purple, n=3) vs. high grade (blue, n=4). Middle panel, Cross-classification analysis of independent clinical breast cancer datasets using the PEGA classifier depicted by the adjoining heat map. Right panel, Plot of the first 2 principal components of the top 5 UP and DN PEGA genes expression levels in HTG and LTG cell lines in the presence or absence of tumor fibroblast (TF) coculture. TF1 and TF2 are independent cases. Open symbols represent control tumor cell lines. Filled symbols denote tumor + fibroblast cocultures. Circles represent HTG cell lines; diamonds indicate LTG cell lines.
Figure 2
Figure 2. Identification of aggressive primary breast cancer by expression levels of the PEGA gene, S100P
A, Kaplan-Meier analysis - S100P expression divided into tertiles; blue – low, red – intermediate; green - high; Log normalized data values for each group: low risk − 3.0 to 7.07, intermediate risk − 7.08 to 9.46, high risk − 9.47 to 13.2. Recurrence-free survival (RFS) for all grades, displayed independently for dataset 1, and dataset 2. B, RFS for intermediate grade tumors in datasets 1 and 2 combined. C, Tumor cell lines of varying grade accurately stratified by S100P expression levels relative to ACTB, and grade of original tumor tissue. C, Immunofluorescence localization of anti-S100P (green) in LTG or ITG (top panels) vs. HTG (bottom panels) cell lines. Nuclei counterstained with propidium iodide (red).
Figure 3
Figure 3. Pleiotropic effects of S100P silencing
A, Expression levels of S100P-COR genes in HTG cell lines altered by S100P knock down. Red bars - CCdl54. Blue bars - CCdl675. Open bars - control siRNA. Solid bars - S100P siRNA. B, Reduction in the number of anti BrdU stained proliferating cells in 3 HTG cell lines transfected with S100P siRNA. Error bars indicate standard deviation between triplicate assays. C, Apolar morphology of HTG colonies propagated in matrigel (top); normalized by S100P silencing to resemble polarized acinar structures (bottom). Blue - immunolocalization of anti S100P, green – actin localization by phalloidin, and red - immunolocalization of anti integrin alpha6. D, Reduction in migration potential induced by S100P siRNA in HTG cell lines. Standard error bars represent triplicate assays.
Figure 4
Figure 4. Stratification of primary breast cancer by tumor size + S100P-COR 3- gene fingerprint, and chemotherapeutic response measurements
A – Left panel, Comparison of Training vs. Test datasets. Training set – solid lines. Test set - dashed lines. Blue - low risk tertile; green - intermediate risk tertile; red - high risk tertile. Right panel, Comparison of ER-negative vs. ER positive cases in the combined datasets based on a median value of the classifier. Purple – low risk/ER-positive; black – low risk/ER-negative; yellow - high risk/ER-positive; maroon – high risk/ER-negative. B, Apoptosis induction measured as Annexin V positive cells in tumor cell lines of varying grade exposed to 200µM cisplatin, 10µM chlorpromazine or W7. Values represent statistically significant differences between unexposed controls and drug-treated cells (p<0.05). C, S100P siRNA-induced loss of chlorpromazine sensitivity demonstrated as declining number of Annexin V positive apoptotic cells in 3 independent HTG cell lines. D, Cell cycle analysis of LTG (CCdl68) and HTG (CCdl675) cell lines in the presence and absence of chlorpromazine. Representative FACS analysis of cells without drug treatment (left panels); with 24 hr. drug exposure (middle panels); or 24 hr. post recovery from drug exposure (right panels). The numbers for pie chart segments indicate the percentage of cells within each cell cycle phase (sub G1, G1, S, and G2).

References

    1. Elston CW, Ellis IO. Pathological prognostic factors in breast cancer. I. The value of histological grade in breast cancer: experience from a large study with long-term follow-up. Histopathology. 1991;19:403–410. - PubMed
    1. Black MM, Barclay TH, Hankey BF. Prognosis in breast cancer utilizing histologic characteristics of the primary tumor. Cancer. 1975;36:2048–2055. - PubMed
    1. Rosen PP, Saigo PE, Braun DW, Jr, Weathers E, DePalo A. Predictors of recurrence in stage I (T1N0M0) breast carcinoma. Ann Surg. 1981;193:15–25. - PMC - PubMed
    1. Hopton DS, Thorogood J, Clayden AD, MacKinnon D. Histological grading of breast cancer; significance of grade on recurrence and mortality. Eur J Surg Oncol. 1989;15:25–31. - PubMed
    1. Ridolfi RL, Rosen PP, Port A, Kinne D, Mike V. Medullary carcinoma of the breast: a clinicopathologic study with 10 year follow-up. Cancer. 1977;40:1365–1385. - PubMed

Publication types