

Modelling spatially correlated survival data for individuals with multiple cancers
- PMID: 19789726
- PMCID: PMC2752904
- DOI: 10.1177/1471082X0700700205
Modelling spatially correlated survival data for individuals with multiple cancers
Abstract
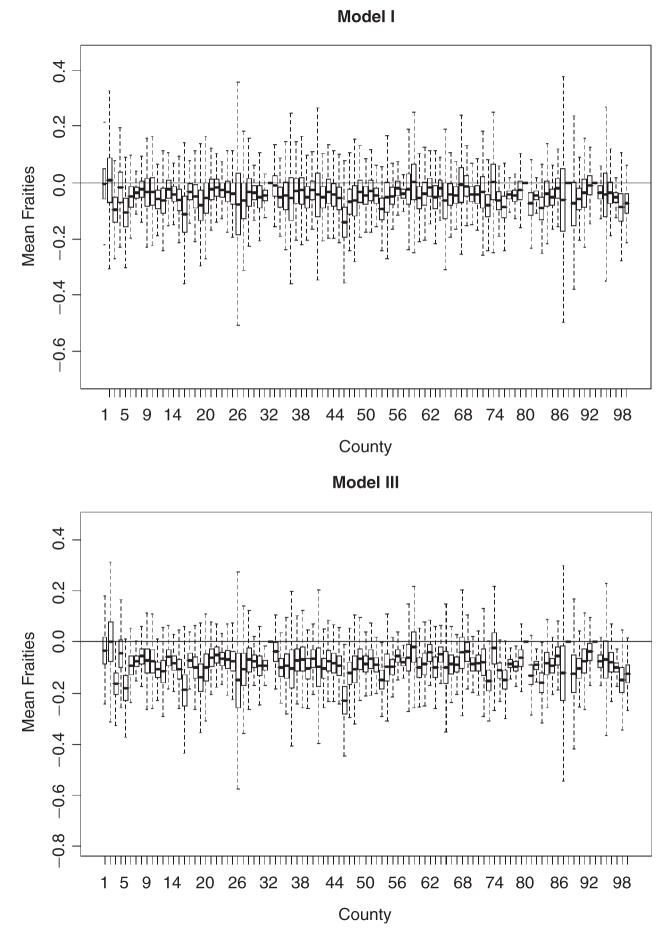
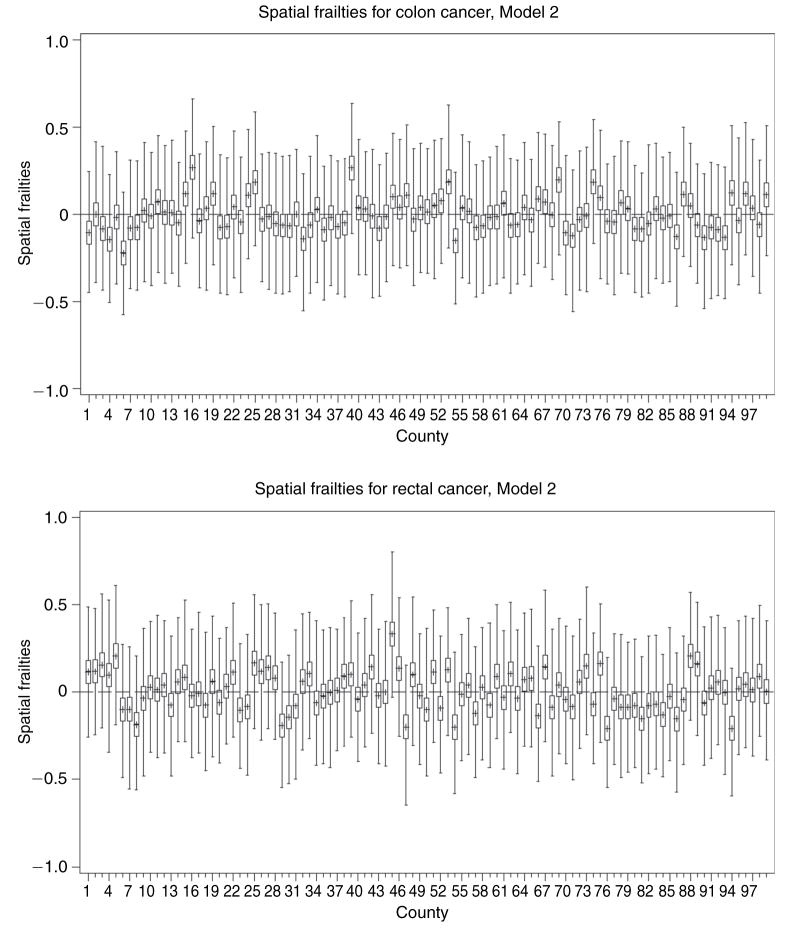
Epidemiologists and biostatisticians investigating spatial variation in diseases are often interested in estimating spatial effects in survival data, where patients are monitored until their time to failure (for example, death, relapse). Spatial variation in survival patterns often reveals underlying lurking factors, which, in turn, assist public health professionals in their decision-making process to identify regions requiring attention. The Surveillance Epidemiology and End Results (SEER) database of the National Cancer Institute provides a fairly sophisticated platform for exploring novel approaches in modelling cancer survival, particularly with models accounting for spatial clustering and variation. Modelling survival data for patients with multiple cancers poses unique challenges in itself and in capturing the spatial associations of the different cancers. This paper develops the Bayesian hierarchical survival models for capturing spatial patterns within the framework of proportional hazard. Spatial variation is introduced in the form of county-cancer level frailties. The baseline hazard function is modelled semiparametrically using mixtures of beta distributions. We illustrate with data from the SEER database, perform model checking and comparison among competing models, and discuss implementation issues.
Figures


References
-
- Agarwal D, Gelfand AE. Slice Gibbs sampling for simulation based fitting of spatial models. Statistics and Computing. 2005;15:61–69.
-
- Banerjee S, Carlin BP. Semi-parametric spatiotemporal analysis. Environmetrics. 2003;14:523–35.
-
- Banerjee S, Carlin BP, Gelfand AE. Hierarchical Modeling and Analysis for Spatial Data. Boca Raton: Chapman and Hall/CRC; 2004.
-
- Banerjee S, Dey DK. Semiparametric proportional odds model for spatially correlated survival data. Lifetime Data Analysis. 2005;11:175–91. - PubMed
-
- Banerjee S, Wall M, Carlin BP. Frailty modelling for spatially correlated survival data with application to infant mortality in Minnesota. Biostatistics. 2003;4:123–42. - PubMed
Grants and funding
LinkOut - more resources
Full Text Sources