Comparative Study
. 2010 Apr;20(4):771-81.
doi: 10.1007/s00330-009-1616-y. Epub 2009 Sep 30.

Selection of diagnostic features on breast MRI to differentiate between malignant and benign lesions using computer-aided diagnosis: differences in lesions presenting as mass and non-mass-like enhancement

Affiliations
Comparative Study

Selection of diagnostic features on breast MRI to differentiate between malignant and benign lesions using computer-aided diagnosis: differences in lesions presenting as mass and non-mass-like enhancement

Dustin Newell et al. Eur Radiol. 2010 Apr.

Abstract

Purpose: To investigate methods developed for the characterisation of the morphology and enhancement kinetic features of both mass and non-mass lesions, and to determine their diagnostic performance to differentiate between malignant and benign lesions that present as mass versus non-mass types.

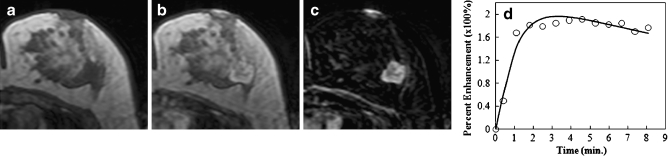
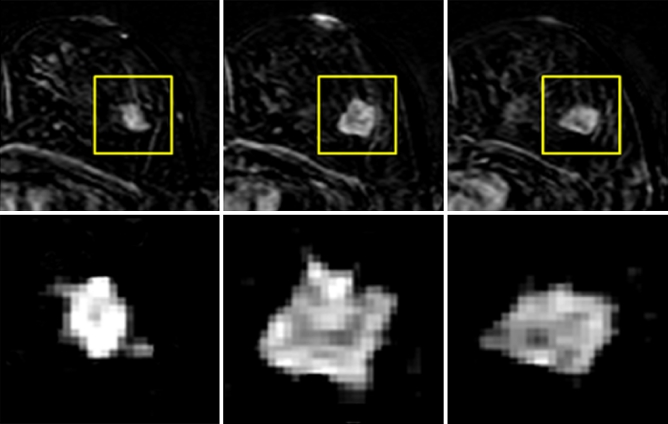
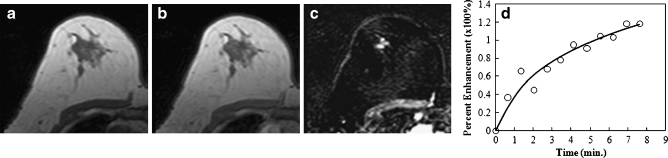
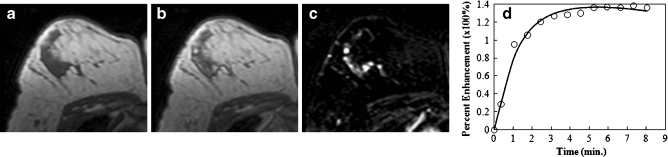
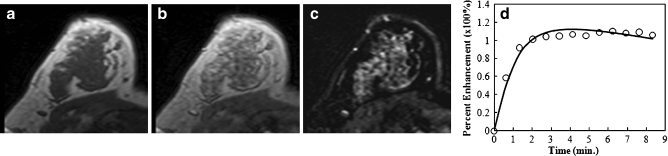
Methods: Quantitative analysis of morphological features and enhancement kinetic parameters of breast lesions were used to differentiate among four groups of lesions: 88 malignant (43 mass, 45 non-mass) and 28 benign (19 mass, 9 non-mass). The enhancement kinetics was measured and analysed to obtain transfer constant (K(trans)) and rate constant (k(ep)). For each mass eight shape/margin parameters and 10 enhancement texture features were obtained. For the lesions presenting as nonmass-like enhancement, only the texture parameters were obtained. An artificial neural network (ANN) was used to build the diagnostic model.

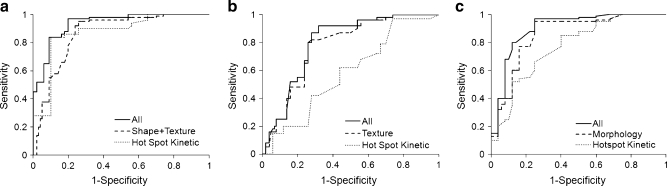
Results: For lesions presenting as mass, the four selected morphological features could reach an area under the ROC curve (AUC) of 0.87 in differentiating between malignant and benign lesions. The kinetic parameter (k(ep)) analysed from the hot spot of the tumour reached a comparable AUC of 0.88. The combined morphological and kinetic features improved the AUC to 0.93, with a sensitivity of 0.97 and a specificity of 0.80. For lesions presenting as non-mass-like enhancement, four texture features were selected by the ANN and achieved an AUC of 0.76. The kinetic parameter k(ep) from the hot spot only achieved an AUC of 0.59, with a low added diagnostic value.

Conclusion: The results suggest that the quantitative diagnostic features can be used for developing automated breast CAD (computer-aided diagnosis) for mass lesions to achieve a high diagnostic performance, but more advanced algorithms are needed for diagnosis of lesions presenting as non-mass-like enhancement.


Figures

Fig. 1
Fig. 1
An example of a malignant mass (invasive ductal cancer) from a 43-year-old patient, showing an unenhanced non-fat-saturated T1-weighted image (a), enhanced image taken at 1 min after injection (b), subtraction image (c), and the enhancement kinetics normalised to the unenhanced signal intensity (d). The lesion demonstrates lobulated rim enhancement and shows the typical malignant enhancement kinetics pattern with rapid wash-in followed by wash-out
Fig. 2
Fig. 2
The magnified view of the tumour ROI drawn from three slices of the mass lesion shown in Fig. 1. The subtraction image at 1-min after contrast injection is shown. The in-plane resolution is 1.4 × 1.4 mm, and the slice thickness is 4 mm. There is no visible spiculation, which may be due to the relatively low spatial resolution, as well as any slight motion between pre- and post-contrast images
Fig. 3
Fig. 3
An example of a benign mass (fibroadenoma and adenosis) from a 54-year-old patient, showing an unenhanced non-fat-saturated T1-weighted image (a), enhanced image taken at 1 min after injection (b), subtraction image (c), and the enhancement kinetics normalised to the unenhanced signal intensity (d). The lesion is lobulated and shows non-enhancing internal septations on the subtraction image. The enhancement kinetics curve shows a slow initial enhancement and a persistent enhancement pattern during the 8 min following injection of contrast agent
Fig. 4
Fig. 4
The ROC curves from the ANN analysis for the lesions presenting as mass (a), lesions presenting as non-mass-like enhancement (b), and all lesions (c). For mass lesions the area under ROC curve (AUC) is 0.87 based on morphological features, 0.88 based on hot spot k ep, and improves to 0.93 using combined morphological and kinetic features. For non-mass-like lesions, the AUC is 0.76 based on texture features, only 0.59 based on hot spot k ep, and slightly improves to 0.78 using combined texture and kinetic features. For all lesions, the AUC is 0.81 based on texture features, 0.79 based on hot spot k ep, and 0.86 using combined texture and kinetic features
Fig. 5
Fig. 5
An example of a malignant lesion presenting as non-mass-like enhancement (ductal carcinoma in situ) from a 47-year-old patient, showing an unenhanced non-fat-saturated T1-weighted image (a), enhanced image taken at 1 min after injection (b), subtraction image (c), and the enhancement kinetics normalised to the unenhanced signal intensity (d). The lesion demonstrates a linear clumped enhancement pattern on the subtraction image. The enhancement kinetics curve shows rapid wash-in and reaches a plateau
Fig. 6
Fig. 6
An example of a benign lesion presenting as non-mass-like enhancement (fibrocystic changes) from a 49-year-old patient, showing an unenhanced non-fat-saturated T1-weighted image (a), enhanced image taken at 1 min after injection (b), subtraction image (c), and the enhancement kinetics normalised to the unenhanced signal intensity (d). The fibrocystic changes in the right breast show diffuse heterogeneous enhancements on the subtraction image. The enhancement kinetics curve is similar to the DCIS case shown in Fig. 5, showing rapid wash-in and reaching a plateau

References

    1. Saslow D, Boetes C, Burke W, Harms S, Leach MO, Lehman CD, Morris E, Pisano E, Schnall M, Sener S, Smith RA, Warner E, Yaffe M, Andrews KS, Russell CA. American Cancer Society guidelines for breast screening with MRI as an adjunct to mammography. CA Cancer J Clin. 2007;57:75–89. doi: 10.3322/canjclin.57.2.75. - DOI - PubMed
    1. Tillman GF, Orel SG, Schnall MD. Effect of breast magnetic resonance imaging on the clinical management of women with early-stage breast carcinoma. J Clin Oncol. 2002;20:3413–3423. doi: 10.1200/JCO.2002.08.600. - DOI - PubMed
    1. Kuhl CK, Schrading S, Leutner CC. Mammography, breast ultrasound, and magnetic resonance imaging for surveillance of women at high familial risk for breast cancer. J Clin Oncol. 2005;23:8469–8476. doi: 10.1200/JCO.2004.00.4960. - DOI - PubMed
    1. Schelfout K, Van Goethem M, Kersschot E, Colpaert C, Schelfhout AM, Leyman P, Verslegers I, Biltjes I, Van Den Haute J, Gillardin JP, Tjalma W, Van Der Auwera JC, Buytaert P, De Schepper A. Contrast-enhanced MR imaging of breast lesions and effect on treatment. Eur J Surg Oncol. 2004;30:501–507. doi: 10.1016/j.ejso.2004.02.003. - DOI - PubMed
    1. Kuhl CK, Schrading S, Bieling HB, Wardelmann E, Leutner CC, Koenig R, Kuhn W, Schild HH. MRI for diagnosis of pure ductal carcinoma in situ: a prospective observational study. Lancet. 2007;370:485–492. doi: 10.1016/S0140-6736(07)61232-X. - DOI - PubMed

Publication types