

Neuroanatomical differences in brain areas implicated in perceptual and other core features of autism revealed by cortical thickness analysis and voxel-based morphometry
- PMID: 19790171
- PMCID: PMC6870833
- DOI: 10.1002/hbm.20887
Neuroanatomical differences in brain areas implicated in perceptual and other core features of autism revealed by cortical thickness analysis and voxel-based morphometry
Abstract
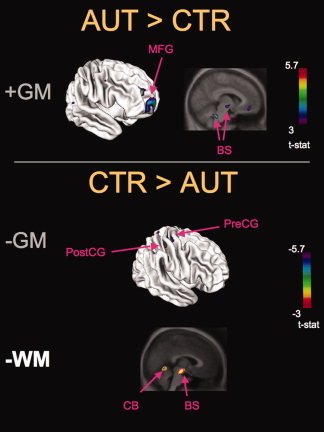
Autism spectrum disorder is a complex neurodevelopmental variant thought to affect 1 in 166 [Fombonne (2003): J Autism Dev Disord 33:365-382]. Individuals with autism demonstrate atypical social interaction, communication, and repetitive behaviors, but can also present enhanced abilities, particularly in auditory and visual perception and nonverbal reasoning. Structural brain differences have been reported in autism, in terms of increased total brain volume (particularly in young children with autism), and regional gray/white matter differences in both adults and children with autism, but the reports are inconsistent [Amaral et al. (2008): Trends Neurosci 31:137-145]. These inconsistencies may be due to differences in diagnostic/inclusion criteria, and age and Intelligence Quotient of participants. Here, for the first time, we used two complementary magnetic resonance imaging techniques, cortical thickness analyses, and voxel-based morphometry (VBM), to investigate the neuroanatomical differences between a homogenous group of young adults with autism of average intelligence but delayed or atypical language development (often referred to as "high-functioning autism"), relative to a closely matched group of typically developing controls. The cortical thickness and VBM techniques both revealed regional structural brain differences (mostly in terms of gray matter increases) in brain areas implicated in social cognition, communication, and repetitive behaviors, and thus in each of the core atypical features of autism. Gray matter increases were also found in auditory and visual primary and associative perceptual areas. We interpret these results as the first structural brain correlates of atypical auditory and visual perception in autism, in support of the enhanced perceptual functioning model [Mottron et al. (2006): J Autism Dev Disord 36:27-43].
Copyright 2009 Wiley-Liss, Inc.
Figures

References
-
- Abell F,Krams M,Ashburner J,Passingham R,Friston K,Frackowiak R,Happe F,Frith C,Frith U ( 1999): The neuroanatomy of autism: A voxel‐based whole brain analysis of structural scans. Neuroreport 10: 1647–1651. - PubMed
-
- Ad‐Dab'bagh Y,Lyttelton O,Muehlboeck JS,Lepage C,Einarson D,Mok K,Ivanov O,Vincent RD,Lerch J,Fombonne E and Evans AC ( 2006): The CIVET image‐processing environment: A fully automated comprehensive pipeline for anatomical neuroimaging research In: Corbetta M, editor. NeuroImage. Florence, Italy.
-
- Adolphs R ( 2001): The neurobiology of social cognition. Curr Opin Neurobiol 11: 231–239. - PubMed
-
- Amaral DG,Schumann CM,Nordahl CW ( 2008): Neuroanatomy of autism. Trends Neurosci 31: 137–145. - PubMed
MeSH terms
LinkOut - more resources
Full Text Sources
Medical
