

Dielectrophoretic-field flow fractionation analysis of dielectric, density, and deformability characteristics of cells and particles
- PMID: 19791772
- PMCID: PMC3754901
- DOI: 10.1021/ac901470z
Dielectrophoretic-field flow fractionation analysis of dielectric, density, and deformability characteristics of cells and particles
Abstract
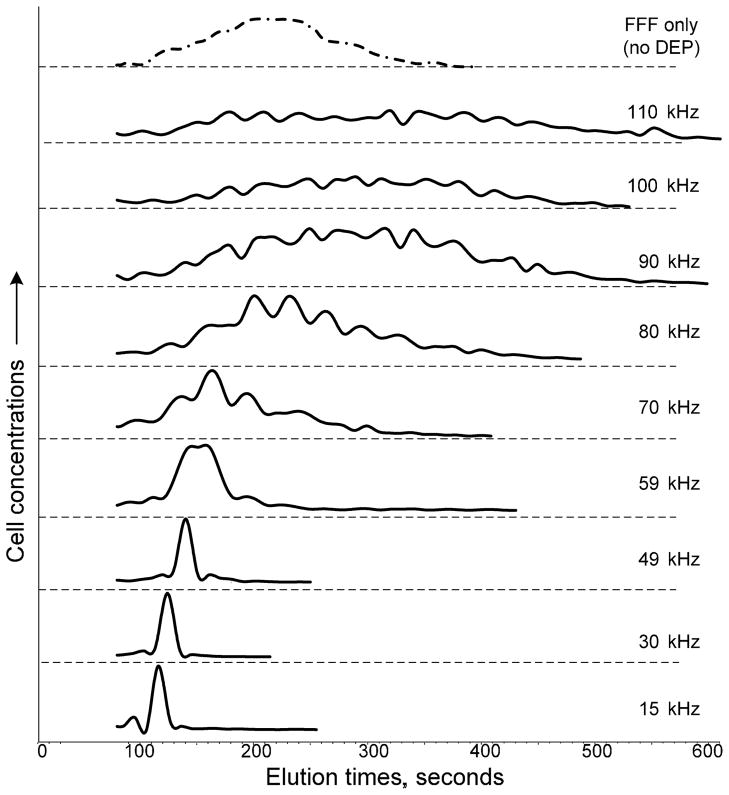
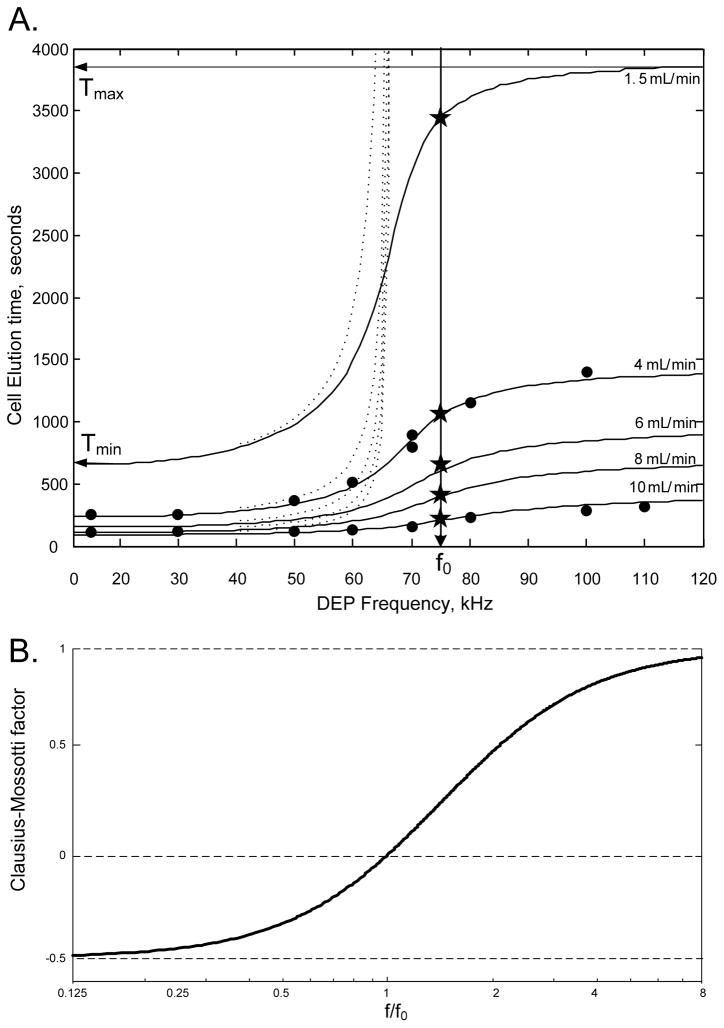
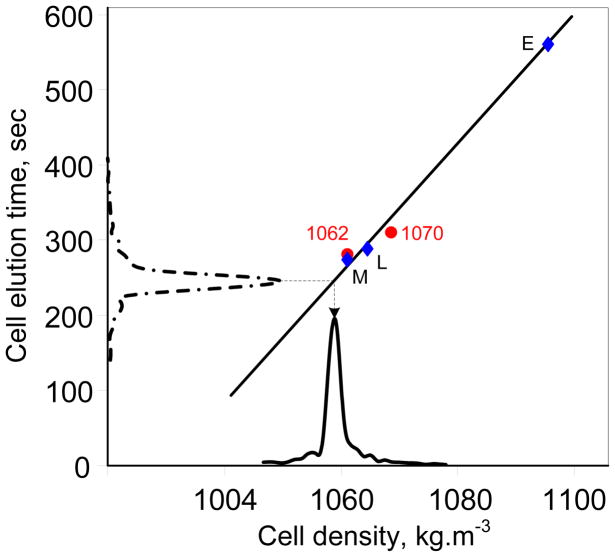
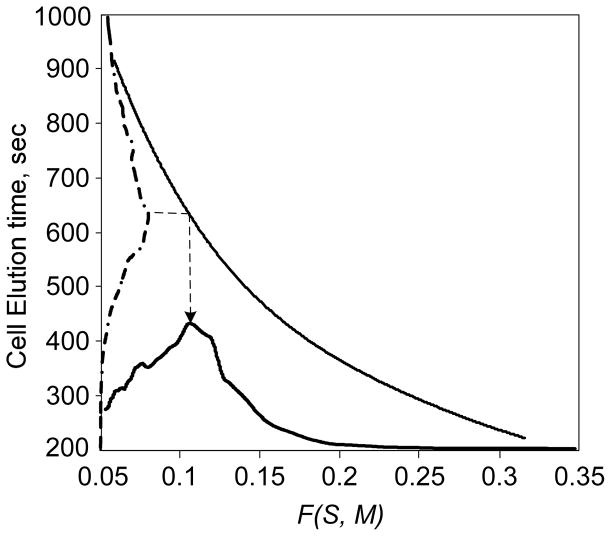
Dielectrophoretic field-flow fractionation (DEP-FFF) has been used to discriminate between particles and cells based on their dielectric and density properties. However, hydrodynamic lift forces (HDLF) at flow rates needed for rapid separations were not accounted for in the previous theoretical treatment of the approach. Furthermore, no method was developed to isolate particle or cell physical characteristics directly from DEP-FFF elution data. An extended theory of DEP-FFF is presented that accounts for HDLF. With the use of DS19 erythroleukemia cells as model particles with frequency-dependent dielectric properties, it is shown that the revised theory accounts for DEP-FFF elution behavior over a wide range of conditions and is consistent with sedimentation-FFF when the DEP force is zero. Conducting four elution runs under specified conditions, the theory allows for the derivation of the cell density distribution and provides good estimates of the distributions of the dielectric properties of the cells and their deformability characteristics that affect HDLF. The approach allows for rapid profiling of the biophysical properties of cells, the identification and characterization of subpopulations, and the design of optimal DEP-FFF separation conditions. The extended DEP-FFF theory is widely applicable, and the parameter measurement methods may be adapted easily to other types of particles.
Figures
Similar articles
-
Separation of polystyrene microbeads using dielectrophoretic/gravitational field-flow-fractionation.Biophys J. 1998 May;74(5):2689-701. doi: 10.1016/S0006-3495(98)77975-5. Biophys J. 1998. PMID: 9591693 Free PMC article.
-
Correlations between the dielectric properties and exterior morphology of cells revealed by dielectrophoretic field-flow fractionation.Electrophoresis. 2013 Apr;34(7):1042-50. doi: 10.1002/elps.201200496. Electrophoresis. 2013. PMID: 23172680 Free PMC article.
-
Dielectrophoretic field-flow fractionation of electroporated cells.Electrophoresis. 2012 Sep;33(18):2867-74. doi: 10.1002/elps.201200265. Electrophoresis. 2012. PMID: 23019104
-
Dielectrophoresis-field flow fractionation for separation of particles: A critical review.J Chromatogr A. 2021 Jan 25;1637:461799. doi: 10.1016/j.chroma.2020.461799. Epub 2020 Dec 11. J Chromatogr A. 2021. PMID: 33385744 Review.
-
Fractionation of prion protein aggregates by asymmetrical flow field-flow fractionation.Methods Enzymol. 2006;412:21-33. doi: 10.1016/S0076-6879(06)12002-9. Methods Enzymol. 2006. PMID: 17046649 Review.
Cited by
-
Antibody-independent isolation of circulating tumor cells by continuous-flow dielectrophoresis.Biomicrofluidics. 2013 Jan 16;7(1):11807. doi: 10.1063/1.4774304. eCollection 2013. Biomicrofluidics. 2013. PMID: 24403989 Free PMC article.
-
Separating microparticles by material and size using dielectrophoretic chromatography with frequency modulation.Sci Rep. 2021 Aug 19;11(1):16861. doi: 10.1038/s41598-021-95404-w. Sci Rep. 2021. PMID: 34413323 Free PMC article.
-
Dynamic physical properties of dissociated tumor cells revealed by dielectrophoretic field-flow fractionation.Integr Biol (Camb). 2011 Aug;3(8):850-62. doi: 10.1039/c1ib00032b. Epub 2011 Jun 21. Integr Biol (Camb). 2011. PMID: 21691666 Free PMC article.
-
Exploring the limits of magnetic levitation: submicron particle separation and density profiling.Mater Res Express. 2025 May 1;12(5):056101. doi: 10.1088/2053-1591/add2d8. Epub 2025 May 9. Mater Res Express. 2025. PMID: 40351548 Free PMC article.
-
High-Sensitivity in Dielectrophoresis Separations.Micromachines (Basel). 2020 Apr 9;11(4):391. doi: 10.3390/mi11040391. Micromachines (Basel). 2020. PMID: 32283618 Free PMC article. Review.
References
Publication types
MeSH terms
Grants and funding
LinkOut - more resources
Full Text Sources
