

Structure and thermodynamics of colloidal protein cluster formation: comparison of square-well and simple dipolar models
- PMID: 19791922
- PMCID: PMC2766409
- DOI: 10.1063/1.3238569
Structure and thermodynamics of colloidal protein cluster formation: comparison of square-well and simple dipolar models
Abstract
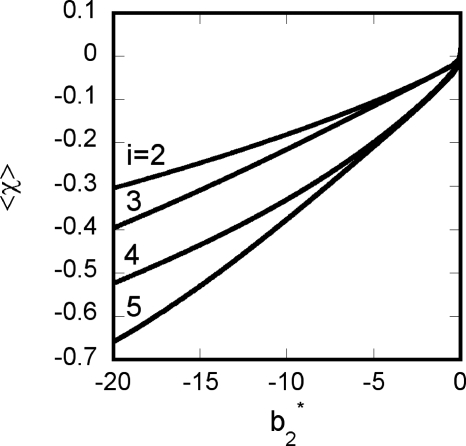
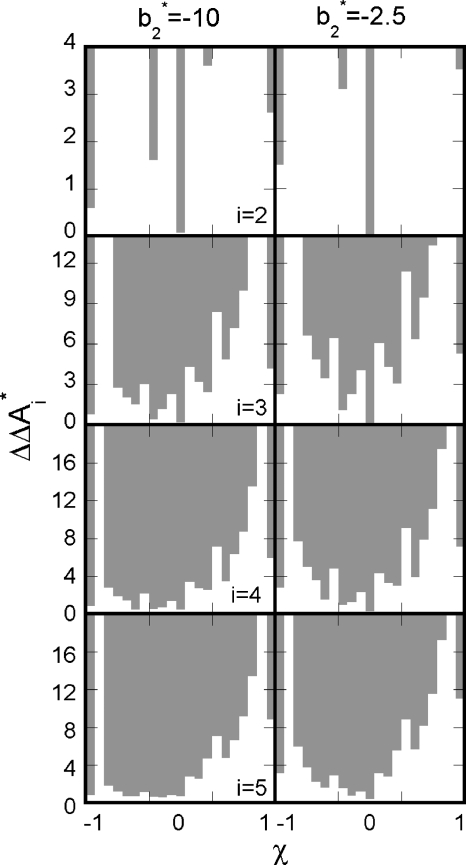
Reversible formation of weakly associated protein oligomers or clusters is a key early step in processes such as protein aggregation and colloidal phase separation. A previously developed cell-based, quasichemical model for lattice fluids [T. M. Young and C. J. Roberts, J. Chem. Phys. 127, 165101 (2007)] is extended here to treat continuous-space systems. It is illustrated using two simplified limiting cases for globular proteins at the isoelectric point: spherical square-well (SW) particles with an isotropic short-ranged attraction and screened dipolar particles with SW attractions and square-shoulder repulsions. Cluster free energies (DeltaA(i)) and structures are analyzed as a function of the reduced second virial coefficient b(2)(*). DeltaA(i) values and the average structures of clusters up to pentamers have distinct differences due to the anisotropic nature of the dipolar interactions. However, DeltaA(i) values can be mapped semiquantitatively between the two cases if compared at common values of b(2)(*). Free energy landscapes of oligomerization are constructed, illustrating significant differences in landscape ruggedness for small clusters of dipolar versus SW fluids, and suggesting a possible molecular interpretation for empirical models of nucleation-dependent aggregation of proteins.
Figures
Similar articles
-
Coarse-grained model for colloidal protein interactions, B(22), and protein cluster formation.J Phys Chem B. 2013 Dec 19;117(50):16013-28. doi: 10.1021/jp409300j. Epub 2013 Dec 10. J Phys Chem B. 2013. PMID: 24289039 Free PMC article.
-
A quasichemical approach for protein-cluster free energies in dilute solution.J Chem Phys. 2007 Oct 28;127(16):165101. doi: 10.1063/1.2779323. J Chem Phys. 2007. PMID: 17979394
-
Insights into crowding effects on protein stability from a coarse-grained model.J Biomech Eng. 2009 Jul;131(7):071002. doi: 10.1115/1.3127259. J Biomech Eng. 2009. PMID: 19640127
-
Protein aggregation in silico.Trends Biotechnol. 2007 Jun;25(6):254-61. doi: 10.1016/j.tibtech.2007.03.011. Epub 2007 Apr 12. Trends Biotechnol. 2007. PMID: 17433843 Free PMC article. Review.
-
Morphological aspects of oligomeric protein structures.Prog Biophys Mol Biol. 2005 Sep;89(1):9-35. doi: 10.1016/j.pbiomolbio.2004.07.010. Prog Biophys Mol Biol. 2005. PMID: 15895504 Review.
Cited by
-
Increase in surface hydrophobicity of the cataract-associated P23T mutant of human gammaD-crystallin is responsible for its dramatically lower, retrograde solubility.Biochemistry. 2010 Jul 27;49(29):6122-9. doi: 10.1021/bi100664s. Biochemistry. 2010. PMID: 20553008 Free PMC article.
-
Coarse-grained model for colloidal protein interactions, B(22), and protein cluster formation.J Phys Chem B. 2013 Dec 19;117(50):16013-28. doi: 10.1021/jp409300j. Epub 2013 Dec 10. J Phys Chem B. 2013. PMID: 24289039 Free PMC article.
-
Antibody nanoparticle dispersions formed with mixtures of crowding molecules retain activity and in vivo bioavailability.J Pharm Sci. 2012 Oct;101(10):3763-78. doi: 10.1002/jps.23256. Epub 2012 Jul 6. J Pharm Sci. 2012. PMID: 22777686 Free PMC article.
-
Electrostatics and aggregation: how charge can turn a crystal into a gel.J Chem Phys. 2011 Aug 28;135(8):085103. doi: 10.1063/1.3626803. J Chem Phys. 2011. PMID: 21895221 Free PMC article.
-
Role of anisotropic interactions for proteins and patchy nanoparticles.J Phys Chem B. 2014 Nov 6;118(44):12599-611. doi: 10.1021/jp507886r. Epub 2014 Oct 24. J Phys Chem B. 2014. PMID: 25302767 Free PMC article.
References
Publication types
MeSH terms
Substances
Grants and funding
LinkOut - more resources
Full Text Sources
Other Literature Sources