Unraveling the fluctuations of animal motor activity
- PMID: 19792003
- PMCID: PMC2748382
- DOI: 10.1063/1.3211189
Unraveling the fluctuations of animal motor activity
Abstract
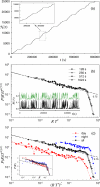
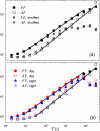
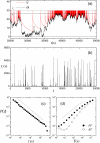
Human and animal behavior exhibits power law correlations whose origin is controversial. In this work, the spontaneous motion of laboratory rodents was recorded during several days. It is found that animal motion is scale-free and that the scaling is introduced by the inactivity pauses both by its length as well as by its specific ordering. Furthermore, the scaling is also demonstrable in the rates of event's occurrence. A comparison with related results in humans is made and candidate models are discussed to provide clues for the origin of such dynamics.
Figures


Similar articles
-
Fermi acceleration and scaling properties of a time dependent oval billiard.Chaos. 2009 Sep;19(3):033142. doi: 10.1063/1.3227740. Chaos. 2009. PMID: 19792022
-
Force network ensemble for the triangular lattice: a tale of tiles.Chaos. 2009 Dec;19(4):041107. doi: 10.1063/1.3207833. Chaos. 2009. PMID: 20059191 No abstract available.
-
Generating ensembles of two-dimensional granular configurations.Chaos. 2009 Dec;19(4):041108. doi: 10.1063/1.3207830. Chaos. 2009. PMID: 20059192 No abstract available.
-
Introduction to focus issue: intracellular Ca2+ dynamics--a change of modeling paradigm?Chaos. 2009 Sep;19(3):037101. doi: 10.1063/1.3234259. Chaos. 2009. PMID: 19792027
-
Avoiding numerical pitfalls in social force models.Phys Rev E Stat Nonlin Soft Matter Phys. 2013 Jun;87(6):063305. doi: 10.1103/PhysRevE.87.063305. Epub 2013 Jun 14. Phys Rev E Stat Nonlin Soft Matter Phys. 2013. PMID: 23848804
Cited by
-
Seeking safety: Movement dynamics after post-contact immobility.PLoS One. 2024 Aug 22;19(8):e0307370. doi: 10.1371/journal.pone.0307370. eCollection 2024. PLoS One. 2024. PMID: 39172761 Free PMC article.
-
Social interactions model and adaptability of human behavior.Front Physiol. 2011 Dec 20;2:101. doi: 10.3389/fphys.2011.00101. eCollection 2011. Front Physiol. 2011. PMID: 22194724 Free PMC article.
-
Scale-free behavioral dynamics directly linked with scale-free cortical dynamics.Elife. 2023 Jan 27;12:e79950. doi: 10.7554/eLife.79950. Elife. 2023. PMID: 36705565 Free PMC article.
-
Role of the circadian clock in the statistics of locomotor activity in Drosophila.PLoS One. 2018 Aug 23;13(8):e0202505. doi: 10.1371/journal.pone.0202505. eCollection 2018. PLoS One. 2018. PMID: 30138403 Free PMC article.
-
Time crystal dynamics in a weakly modulated stochastic time delayed system.Sci Rep. 2022 Mar 22;12(1):4914. doi: 10.1038/s41598-022-08776-y. Sci Rep. 2022. PMID: 35318359 Free PMC article.
References
-
- Vazquez A., Physica A PHYADX 373, 747 (2007).10.1016/j.physa.2006.04.060 - DOI
-
- Stouffer D. B., Malmgreen R. D., and Amaral L. A. N., e-print arXiv:physics∕0510216 and arXiv:physics∕0605027
- Barabási A. -L., Goh K. -I., and Vazquez A., e-print arXiv:physics∕0511186
- Malmgren R. D., Stouffer D. B., Motter A. E., and Amaral L. A. N., Proc. Natl. Acad. Sci. U.S.A. PNASA6 105, 18153 (2008).10.1073/pnas.0800332105 - DOI - PMC - PubMed
-
- Anteneodo C., Dean Malmgren R., and Chialvo D. R., e-print arXiv:0907.1263.
Publication types
MeSH terms
Grants and funding
LinkOut - more resources
Full Text Sources

