

Comparative Study
doi: 10.1063/1.3156402.
An investigation of models of the IP3R channel in Xenopus oocyte
Affiliations
- PMID: 19792030
- PMCID: PMC2771705
- DOI: 10.1063/1.3156402
Item in Clipboard
Comparative Study
An investigation of models of the IP3R channel in Xenopus oocyte
Chaos.
2009 Sep.
Abstract
We consider different models of inositol 1,4,5-trisphosphate (IP(3)) receptor (IP(3)R) channels in order to fit nuclear membrane patch clamp data of the stationary open probability, mean open time, and mean close time of channels in the Xenopus oocyte. Our results indicate that rather than to treat the tetrameric IP(3)R as four independent and identical subunits, one should assume sequential binding-unbinding processes of Ca(2+) ions and IP(3) messengers. Our simulations also favor the assumption that a channel opens through a conformational transition from a close state to an active state.
Figures
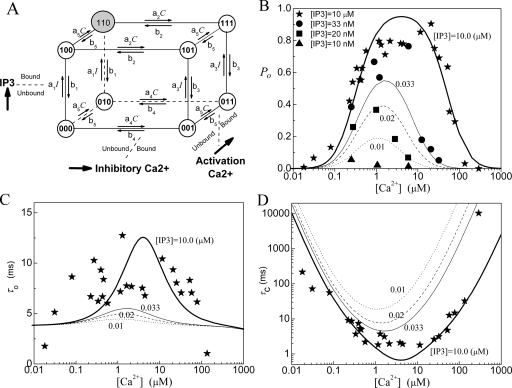
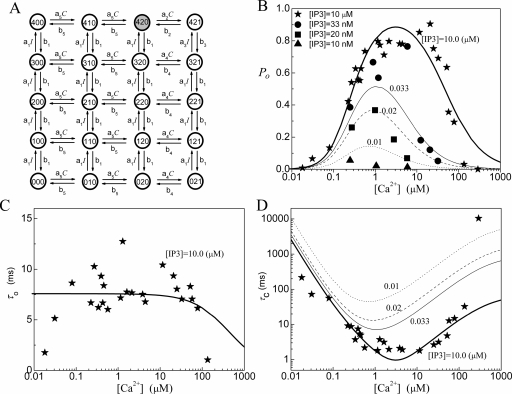
Model 1: (a) The structure of the De Young–Keizer IP3R subunit model. The graph shows the dependence of (b) the open probability PO, (c) the mean open time τO, and (d) the mean close time τC as a function of Ca2+ concentration for different concentrations of IP3. The lines show the results calculated with the deterministic transition matrix theory and the symbols show the results obtained from single-channel patch clamp from IP3R on native nuclear membranes (Refs. 11, 12, 13). Here, thick lines and stars are for [IP3]=10 μM, thin lines and circles are for 0.033 μM, dashed lines and squares are for 0.02 μM, and dotted lines and triangles are for 0.01 μM. Same notations are used in the following figures. The parameters used in the model are K1=0.0072 μM, K2=78 μM, K3=0.22 μM, K4=K1K2∕K3, K5=0.21 μM, a1=500 μM−1 s−1, a2=0.01 μM−1 s−1, and a5=400 μM−1 s−1.

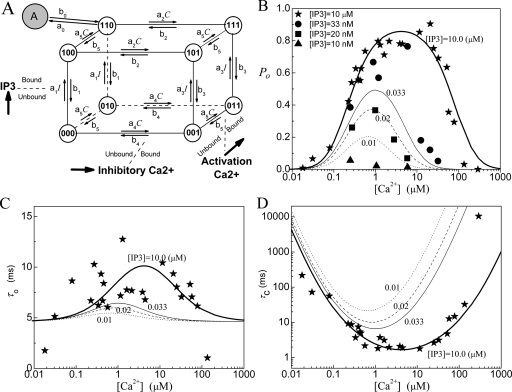
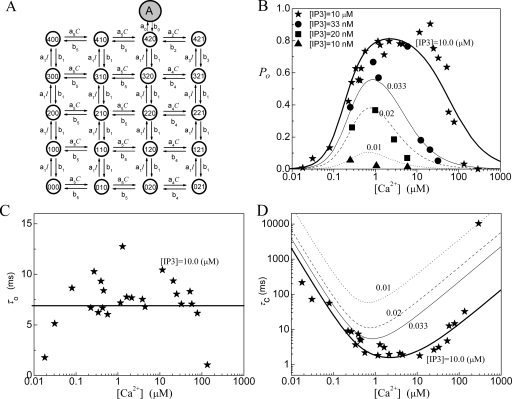
Model 2: (a) The subunit structure of the channel model, (b) the open probability PO, (c) the mean open time τO, and (d) the mean close time τC. In the model K1=0.008 μM, K2=78 μM, K3=0.22 μM, K4=K1K2∕K3, K5=0.21 μM, a1=400 μM−1 s−1, a2=0.01 μM−1 s−1, and a5=400 μM−1 s−1.
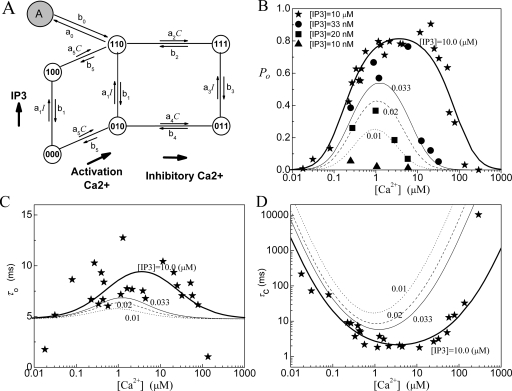
Model 3: (a) The subunit structure of the channel model. A conformational transition to an active state (state-A) occurs before the subunit can contribute to channel opening. (b) The open probability PO, (c) the mean open time τO, and (d) the mean close time τC. In the model K1=0.0054 μM, K2=17.6 μM, K3=0.64 μM, K4=K1K2∕K3, and K5=1.04 μM. For the conformational change, K0=0.135 μM and a0=535 μM−1 s−1.
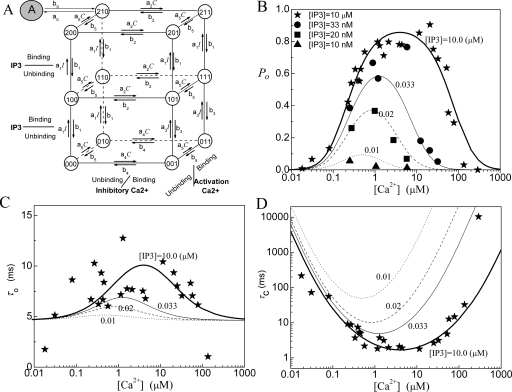
Model 4: (a) The subunit structure of the channel model, (b) the open probability PO, (c) the mean open time τO, and (d) the mean close time τC. In the model K1=0.018 μM, K2=24 μM, K3=0.4 μM, K4=K1K2∕K3, K5=0.56 μM, and K0=0.194 μM with a0=360 μM−1 s−1.
Model 5: (a) The subunit structure of the channel model, (b) the open probability PO, (c) the mean open time τO, and (d) the mean close time τC. In the model K1=0.005 μM, K2=15.6 μM, K3=2.25 μM, K4=K1K2∕K3, K5=1.01 μM, and K0=0.135 μM with a0=535 μM−1 s−1.
Model 6: (a) The state structure of the sequential binding IP3R model, (b) the open probability PO, (c) the mean open time τO, and (d) the mean close time τC. In (c), the mean open time is independent of IP3 concentration. In the model K1=0.009 μM, K2=48 μM, K3=0.3 μM, K4=K1K2∕K3, K5=0.18 μM, a1=240 μM−1 s−1, a2=0.3 μM−1 s−1, and a5=720 μM−1 s−1.
Model 7: (a) The state structure of the sequential binding IP3R model, (b) the open probability PO, (c) the mean open time τO, and (d) the mean close time τC. In the model K1=0.016 μM, K2=8 μM, K3=0.3 μM, K4=K1K2∕K3, K5=0.44 μM, and K0=0.151 μM with a0=960 μM−1 s−1.
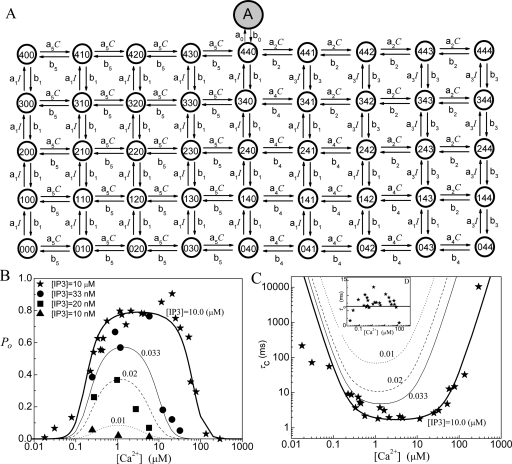
Model 8: (a) The state structure of the sequential binding IP3R model, (b) the open probability PO, and (c) the mean close time τC. The inset figure in (c) is the plot of the mean open time τO. In the model K1=0.02 μM, K2=53 μM, K3=0.2 μM, K4=K1K2∕K3, K5=0.21 μM, and K0=0.233 μM with a0=155 μM−1 s−1.
Similar articles
-
Targeting and clustering of IP3 receptors: key determinants of spatially organized Ca2+ signals.Chaos. 2009 Sep;19(3):037102. doi: 10.1063/1.3127593. Chaos. 2009. PMID: 19798811 Review.
-
Inositol trisphosphate receptor and ion channel models based on single-channel data.Chaos. 2009 Sep;19(3):037104. doi: 10.1063/1.3184540. Chaos. 2009. PMID: 19792029 Free PMC article.
-
Localization and socialization: experimental insights into the functional architecture of IP3 receptors.Chaos. 2009 Sep;19(3):037103. doi: 10.1063/1.3147425. Chaos. 2009. PMID: 19792028 Free PMC article. Review.
-
Toward a predictive model of Ca2+ puffs.Chaos. 2009 Sep;19(3):037108. doi: 10.1063/1.3183809. Chaos. 2009. PMID: 19792033
-
A simple sequential-binding model for calcium puffs.Chaos. 2009 Sep;19(3):037109. doi: 10.1063/1.3152227. Chaos. 2009. PMID: 19792034 Free PMC article.
Cited by
-
Comparison of models for IP3 receptor kinetics using stochastic simulations.PLoS One. 2013 Apr 10;8(4):e59618. doi: 10.1371/journal.pone.0059618. Print 2013. PLoS One. 2013. PMID: 23630568 Free PMC article.
-
Calcium oscillations.Cold Spring Harb Perspect Biol. 2011 Mar 1;3(3):a004226. doi: 10.1101/cshperspect.a004226. Cold Spring Harb Perspect Biol. 2011. PMID: 21421924 Free PMC article. Review.
-
Calcium domains around single and clustered IP3 receptors and their modulation by buffers.Biophys J. 2010 Jul 7;99(1):3-12. doi: 10.1016/j.bpj.2010.02.059. Biophys J. 2010. PMID: 20655827 Free PMC article.
-
Termination of Ca²+ release for clustered IP₃R channels.PLoS Comput Biol. 2012 May;8(5):e1002485. doi: 10.1371/journal.pcbi.1002485. Epub 2012 May 31. PLoS Comput Biol. 2012. PMID: 22693433 Free PMC article.
-
Modulation of elementary calcium release mediates a transition from puffs to waves in an IP3R cluster model.PLoS Comput Biol. 2015 Jan 8;11(1):e1003965. doi: 10.1371/journal.pcbi.1003965. eCollection 2015 Jan. PLoS Comput Biol. 2015. PMID: 25569772 Free PMC article.
References
Publication types
MeSH terms
Substances
Grants and funding
LinkOut - more resources
Full Text Sources
Miscellaneous