Review
. 2009 Sep;5(7):959-75.
doi: 10.2217/fon.09.77.

Diffusion-weighted imaging in head and neck cancers

Affiliations
Review

Diffusion-weighted imaging in head and neck cancers

Sanjeev Chawla et al. Future Oncol. 2009 Sep.

Abstract

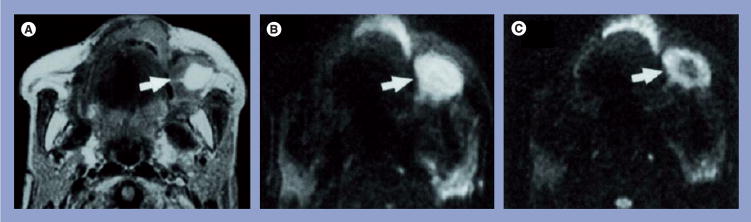
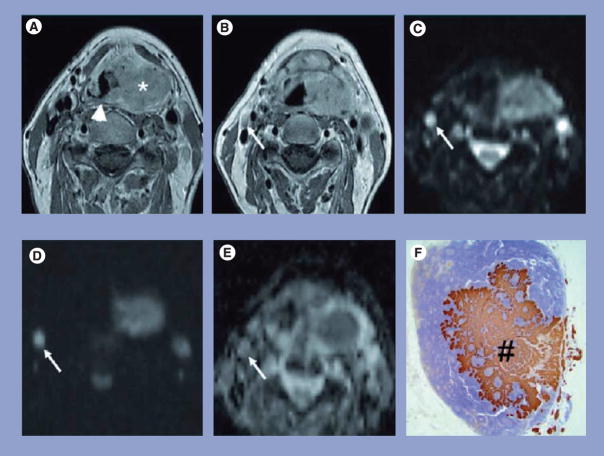
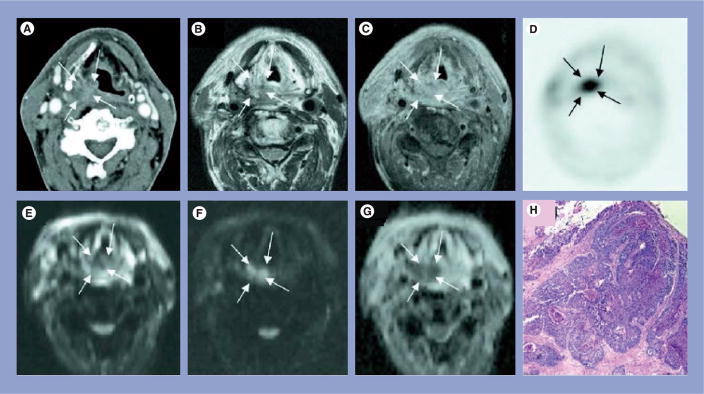
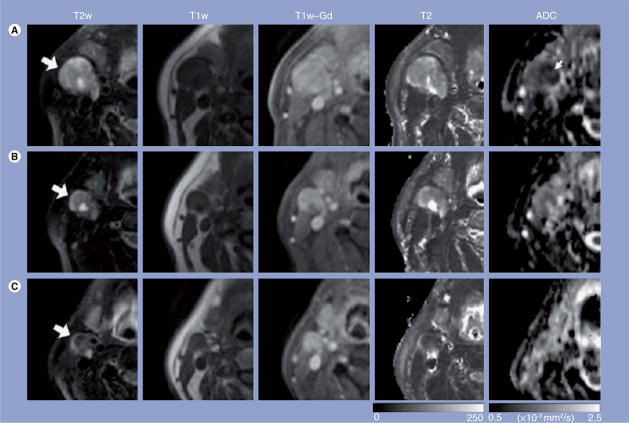
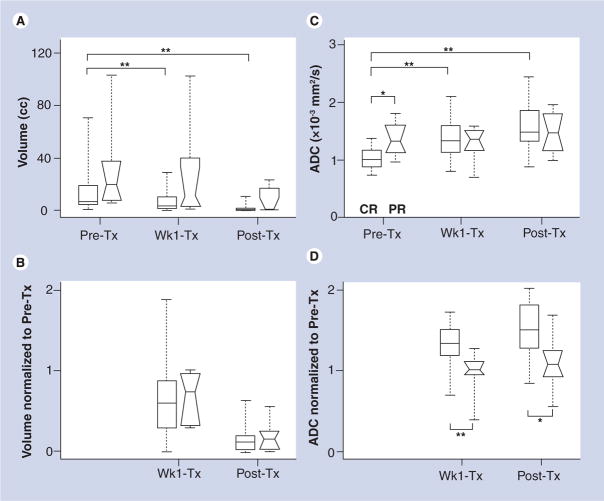
This article reviews the utility of diffusion-weighted imaging (DWI) in the diagnosis, prognosis and monitoring of treatment response in tumors arising in the head and neck region. The apparent diffusion coefficient (ADC) value, determined from DWI, can help in cancer staging and detection of subcentimeter nodal metastasis. The ADC value also discriminates carcinomas from lymphomas, benign lesions from malignant tumors and tumor necrosis from abscesses. Low pretreatment ADC values typically predict a favorable response to chemoradiation therapy. These promising reports indicate the potential of DWI as a potential biomarker for diagnosis and monitoring of treatment response in head and neck cancers. In view of the overlapping ADC values between different salivary gland tumors, care should be taken when interpreting these results and other imaging parameters should be considered for a better diagnosis. Susceptibility and motion-induced artifacts may sometimes degrade DWI image quality; however, novel techniques are being developed to overcome these drawbacks.


Figures

Figure 1
Figure 1. Representative case of a well-differentiated squamous cell carcinoma of the maxilla
(A) Axial spin–spin relaxation time-weighted image of a metastatic buccinator node (arrow) that shows a large, hyperintense necrotic area. (B) Axial diffusion-weighted echo-planar MR image at b factor of 500 s/mm2, the metastatic node appears hyperintense (arrow). (C) Axial diffusion-weighted echo-planar MR image at b factor of 1000 s/mm2, the metastatic node exhibits a central hypointense area (arrow) corresponding to the partially necrotic portion of the node. The mean apparent diffusion coefficient of the node was 0.410 × 10⁻³ mm2/s. MR: Magnetic resonance. Reprinted with permission from [22].
Figure 2
Figure 2. Representative MRI and pathology sections of a squamous cell carcinoma patient with metastatic lymph node
(A) Transverse gadolinium-enhanced T1-weighted TSE MR image in a 57-year-old man shows a large left-sided tumor mass (*) centered on the piriform sinus involving the supraglottic gland and crossing the midline on the posterior pharyngeal wall (arrowhead). (B) Transverse gadolinium-enhanced T1-weighted TSE MR image from the same patient shows a small oval-shaped lymph node at level 2 on the right side with a shortest transverse diameter of 0.6 cm (arrow); this lymph node was considered to be negative for cancer. (C) The lymph node (arrow) is hyperintense on the b = 0 s/mm2 image. (D) Only a limited signal loss is seen on the b = 1000 s/mm2 DWI image. (E) The ADC map demonstrated the lymph node to have an ADC value of 0.71 × 10⁻³ mm2/s, which was suspicious for metastatic adenopathy. (F) Corresponding prekeratin-stained histopathologic slice shows an intranodal metastatic deposit (#). ADC: Apparent diffusion coefficient; T1: Spin-lattice relaxation; TSE MR: Turbo spin-echo magnetic resonance. Reprinted with permission from [25].
Figure 3
Figure 3. Representative MRI and pathology sections from a squamous cell carcinoma patient who demonstrated recurrences at the local site
(A) Computed tomography image showing asymmetric soft tissue thickening in the right aryepiglottic fold and piriform sinus that is suspected for tumor recurrence (arrows). (B) Spin–spin relaxation time-weighted turbo spin-echo image, and (C) post-contrast T1-weighted TSE image confirm the presence of the right hypopharyngeal mass. (D) The lesion correlates with focal increased tracer-uptake on the 18-fluorodeoxyglucose positron emission tomography image; (E) on diffusion-weighted MRI, the lesion is hypointense compared with the surrounding tissues on the b = 0 s/mm2 image, (F) hyperintense on the b = 1000 s/mm2 image, and (G) hypointense on the apparent diffusion coefficient map, thereby showing restricted diffusion and is indicative of a hypercellular lesion:tumor recurrence. (H) Tumor recurrence was confirmed on histopathology. T1: Spin-lattice relaxation; TSE: Turbo spin echo. Reprinted with permission from [24].
Figure 4
Figure 4. Representative images of a patient who exhibited complete response to treatment
Images in each row are from three measurement time points: (A) pretreatment, (B) 1 week into chemoradiation therapy and (C) post-treatment. The T2w, T1w and T1w-Gd images were windowed to have similar image contrast, whereas spin–spin relaxation time and ADC images were scaled based on the grayscale bars shown at the bottom of the corresponding images. Large arrows point to the same nodal metastatic mass that was followed through the treatment course; the small arrow (ADC map) shows the central region of the mass with lower ADC values than the peripheral region. ADC: Apparent diffusion coefficient; T1: Spin-lattice relaxation; T2: Spin–spin relaxation time; T1w: T1-weighted; T1w-Gd: T1-weighted postcontrast enhanced; T2w: T2-weighted. Reprinted with permission from [29].
Figure 5
Figure 5. Box and whisker plots from the metastatic node of squamous cell carcinoma patients
Comparison of complete responders (rectangular boxes) and partial responders (boxes with notches) to chemoradiation therapy in terms of (A) volume, (B) normalized (to pretreatment) volume, (C) ADC and (D) normalized ADC. Edges of the boxes represent the 25th and 75th percentiles while the middle lines in the boxes show the median values. Whisker lines are the minimum and maximum values. *p < 0.05; **p < 0.01. ADC: Apparent diffusion coefficient; cc: Cubic centimeters; CR: Complete responders; PR: Partial responders; Pre-Tx: Pretreatment; Post-Tx: Post treatment; Wk1-Tx: 1 week into treatment. Reprinted with permission from [29].

References

    1. Parkin DM, Bray F, Ferlay J, Pisani P. Global cancer statistics, 2002. CA Cancer J Clin. 2005;55:74–108. - PubMed
    1. Pande P, Soni S, Kaur J, et al. Prognostic factors in betel and tobacco related oral cancer. Oral Oncol. 2002;38:491–499. - PubMed
    1. Argiris A, Haraf DJ, Kies MS, Vokes EE. Intensive concurrent chemoradiotherapy for head and neck cancer with 5-fluorouracil- and hydroxyurea-based regimens: reversing a pattern of failure. Oncologist. 2003;8:350–360. - PubMed
    1. Funk GF, Karnell LH, Robinson RA, et al. Presentation, treatment, and outcome of oral cavity cancer: a national cancer data base report. Head Neck. 2002;24:165–180. - PubMed
    1. Syrjanen S. Human papillomavirus infections and oral tumors. Med Microbiol Immunol. 2003;192:123–128. - PubMed

Publication types