. 2010 Jun;14(6B):1443-52.
doi: 10.1111/j.1582-4934.2009.00913.x. Epub 2009 Sep 30.

Molecular risk stratification in advanced heart failure patients

Affiliations

Molecular risk stratification in advanced heart failure patients

Guillaume Lamirault et al. J Cell Mol Med. 2010 Jun.

Abstract

Risk stratification in advanced heart failure (HF) is crucial for the individualization of therapeutic strategy, in particular for heart transplantation and ventricular assist device implantation. We tested the hypothesis that cardiac gene expression profiling can distinguish between HF patients with different disease severity. We obtained tissue samples from both left (LV) and right (RV) ventricle of explanted hearts of 44 patients undergoing cardiac transplantation or ventricular assist device placement. Gene expression profiles were obtained using an in-house microarray containing 4217 muscular organ-relevant genes. Based on their clinical status, patients were classified into three HF-severity groups: deteriorating (n= 12), intermediate (n= 19) and stable (n= 13). Two-class statistical analysis of gene expression profiles of deteriorating and stable patients identified a 170-gene and a 129-gene predictor for LV and RV samples, respectively. The LV molecular predictor identified patients with stable and deteriorating status with a sensitivity of 88% and 92%, and a specificity of 100% and 96%, respectively. The RV molecular predictor identified patients with stable and deteriorating status with a sensitivity of 100% and 96%, and a specificity of 100% and 100%, respectively. The molecular prediction was reproducible across biological replicates in LV and RV samples. Gene expression profiling has the potential to reproducibly detect HF patients with highest HF severity with high sensitivity and specificity. In addition, not only LV but also RV samples could be used for molecular risk stratification with similar predictive power.


Figures
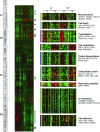
Fig 1
Fig 1
Two-way hierarchical clustering of gene expression data. Left: Classification tree of the samples. The dendrogram is based on similarity of the gene expression profiles of the 176 analysed samples. Samples were separated into four main clusters (A1, A2 and B1, B2). Only clusters containing at least 15 samples were considered as significant. Some samples (indicated *) were not included in any cluster. White, grey and black boxes on the left side of the dendrogram denote stable, intermediate and deteriorating clinical status, respectively. Middle: Heat map of expression values for 176 samples and 4035 genes after hierarchical clustering of both genes and samples. Each column represents the 4035-gene expression profile for one sample. Each row represents the 176-sample expression profile for one gene. Results are presented using a colour code. Green and red represent lower and higher expression levels relative to the median expression level of the gene, respectively. Right: Selected gene clusters indicated by coloured bars in the middle part of the figure. Intermediate samples were removed and remaining samples were ordered based on their origin (LV: left ventricle, RV: right ventricle) and the clinical status of the patient (S: stable, D: deteriorating). On the right side, functional annotation of the clusters is shown. Some genes representative of the functional annotation of the cluster are indicated using their HUGO gene nomenclature committee symbol.
Fig 2
Fig 2
Prediction of HF severity based on gene expression profiles. Top: Gene expression profiles of stable and deteriorating samples for the LV and RV severity predictors. Each column represents the gene expression profile for one sample. Each row represents the relative expression level for one gene. Colour code as in Fig. 1. Bottom: patient classifications for the LV and RV severity predictors. Open and filled circles correspond to stable and deteriorating LV samples, respectively. Open and filled triangles correspond to stable and deteriorating RV samples, respectively. Dashed lines denote upper and lower limits of the unpredictable interval.
Fig 3
Fig 3
Prediction of HF severity in all samples. Individual MSS values obtained for the LV and RV predictors are presented for all 176 analysed samples. Open and black-filled circles correspond to stable and deteriorating LV samples, respectively. Open and black-filled triangles correspond to stable and deteriorating RV samples, respectively. Intermediate samples are shown in grey. Dashed lines denote upper and lower limits of the unpredictable interval.
Fig 4
Fig 4
Between-sample reproducibility. Between-sample reproducibility was assessed using MSS values calculated from biological replicates. Subgroup analysis based on the origin of the sample (LV or RV) is shown. The correlation coefficient was used as a between-sample reproducibility index. Squares: LV samples; Triangles: RV samples. Open symbols: stable samples; grey-filled symbols: intermediate samples; black-filled symbols: deteriorating samples.

References

    1. Lee DS, Austin PC, Rouleau JL, et al. Predicting mortality among patients hospitalized for heart failure: derivation and validation of a clinical model. JAMA. 2003;290:2581–7. - PubMed
    1. Levy WC, Mozaffarian D, Linker DT, et al. The Seattle Heart Failure Model: prediction of survival in heart failure. Circulation. 2006;113:1424–33. - PubMed
    1. Aaronson KD, Schwartz JS, Chen TM, et al. Development and prospective validation of a clinical index to predict survival in ambulatory patients referred for cardiac transplant evaluation. Circulation. 1997;95:2660–7. - PubMed
    1. Smits JM, Deng MC, Hummel M, et al. A prognostic model for predicting waiting-list mortality for a total national cohort of adult heart-transplant candidates. Transplantation. 2003;76:1185–9. - PubMed
    1. Francis GS. Pathophysiology of chronic heart failure. Am J Med. 2001;110:37S–46S. - PubMed

Publication types