

Quantifying differences in the tempo of human immunodeficiency virus type 1 subtype evolution
- PMID: 19793809
- PMCID: PMC2786833
- DOI: 10.1128/JVI.01022-09
Quantifying differences in the tempo of human immunodeficiency virus type 1 subtype evolution
Abstract
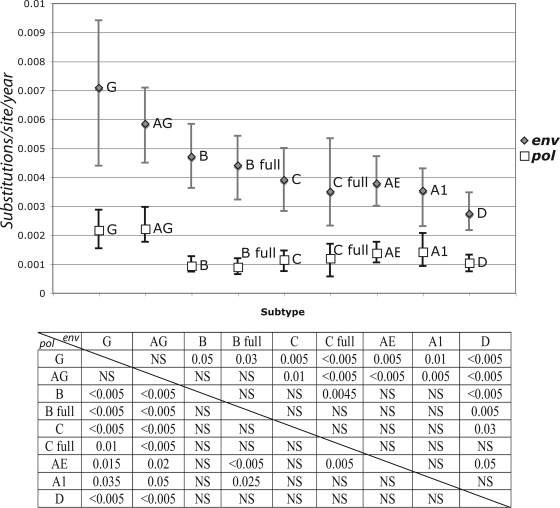
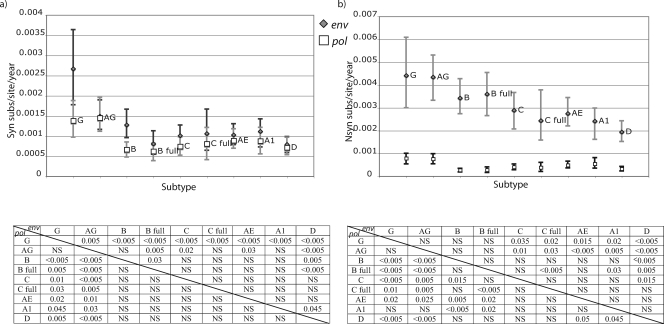
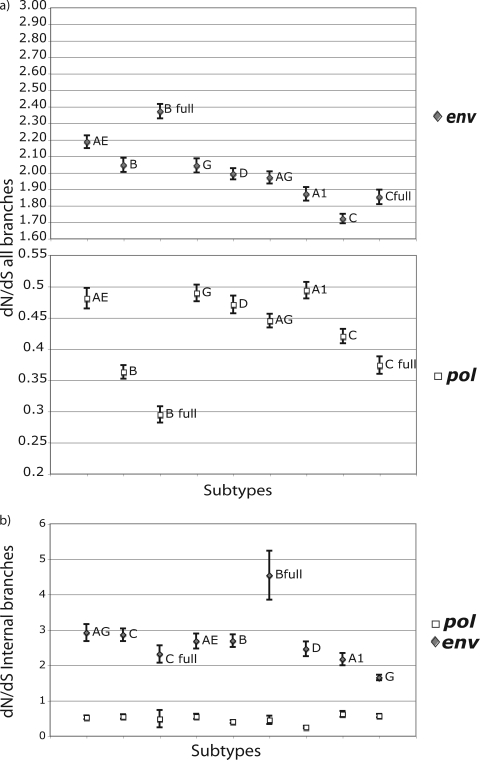
Human immunodeficiency virus type 1 (HIV-1) genetic diversity, due to its high evolutionary rate, has long been identified as a main cause of problems in the development of an efficient HIV-1 vaccine. However, little is known about differences in evolutionary rate between different subtypes. In this study, we collected representative samples of the main epidemic subtypes and circulating recombinant forms (CRFs), namely, sub-subtype A1, subtypes B, C, D, and G, and CRFs 01_AE and 02_AG. We analyzed separate data sets for pol and env. We performed a Bayesian Markov chain Monte Carlo relaxed-clock phylogenetic analysis and applied a codon model to the resulting phylogenetic trees to estimate nonsynonymous (dN) and synonymous (dS) rates along each and every branch. We found important differences in the evolutionary rates of the different subtypes. These are due to differences not only in the dN rate but also in the dS rate, varying in roughly similar ways, indicating that these differences are caused by both different selective pressures (for dN rate) and the replication dynamics (for dS rate) (i.e., mutation rate or generation time) of the strains. CRF02_AG and subtype G had higher rates, while subtype D had lower dN and dS rates than the other subtypes. The dN/dS ratio estimates were also different, especially for the env gene, with subtype G showing the lowest dN/dS ratio of all subtypes.
Figures
References
-
- Abecasis, A., A.-M. Vandamme, and P. Lemey. 2007. Sequence alignment in HIV computational analysis, p. 2-16. In T. Leitner, B. Foley, B. Hahn, P. Marx, F. McCutchan, J. Mellors, S. Wolinsky, and B. Korber (ed.), HIV sequence compendium 2006/2007. Theoretical Biology and Biophysics Group, Los Alamos, NM.
-
- Abecasis, A. B., P. Lemey, N. Vidal, T. de Oliveira, M. Peeters, R. Camacho, B. Shapiro, A. Rambaut, and A. M. Vandamme. 2007. Recombination confounds the early evolutionary history of human immunodeficiency virus type 1: subtype G is a circulating recombinant form. J. Virol. 81:8543-8551. - PMC - PubMed
-
- Baeten, J. M., B. Chohan, L. Lavreys, V. Chohan, R. S. McClelland, L. Certain, K. Mandaliya, W. Jaoko, and J. Overbaugh. 2007. HIV-1 subtype D infection is associated with faster disease progression than subtype A in spite of similar plasma HIV-1 loads. J. Infect. Dis. 195:1177-1180. - PubMed
-
- de Oliveira, T., K. Deforche, S. Cassol, M. Salminen, D. Paraskevis, C. Seebregts, J. Snoeck, E. J. van Rensburg, A. M. Wensing, D. A. van de Vijver, C. A. Boucher, R. Camacho, and A. M. Vandamme. 2005. An automated genotyping system for analysis of HIV-1 and other microbial sequences. Bioinformatics 21:3797-3800. - PubMed
Publication types
MeSH terms
LinkOut - more resources
Full Text Sources
