

Peroxisome proliferator-activated receptor gamma Coactivator 1alpha and small heterodimer partner differentially regulate nuclear receptor-dependent hepatitis B virus biosynthesis
- PMID: 19793822
- PMCID: PMC2786732
- DOI: 10.1128/JVI.01623-09
Peroxisome proliferator-activated receptor gamma Coactivator 1alpha and small heterodimer partner differentially regulate nuclear receptor-dependent hepatitis B virus biosynthesis
Abstract
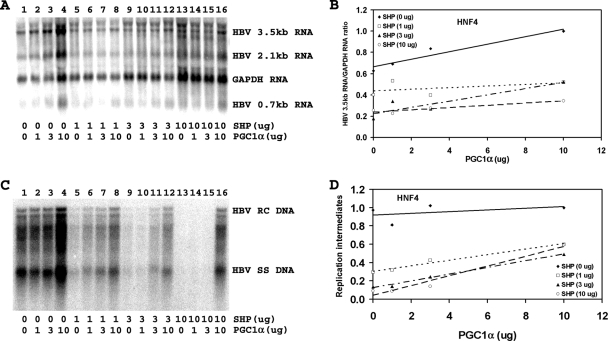
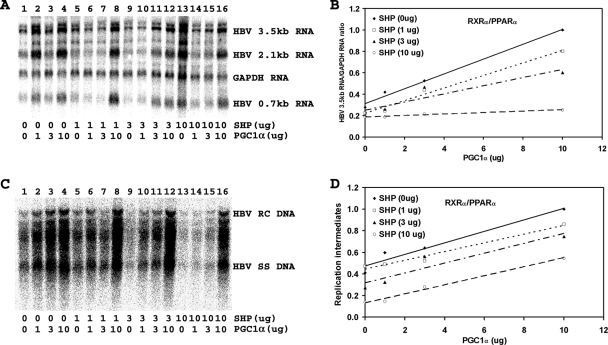
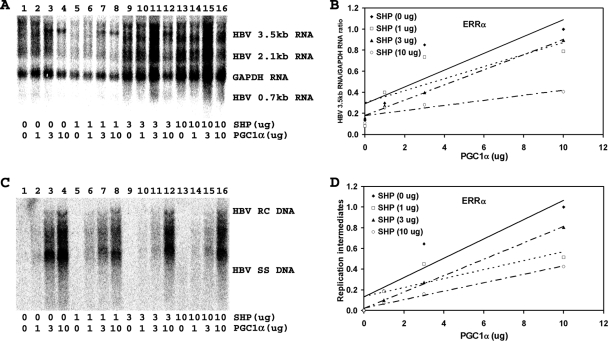
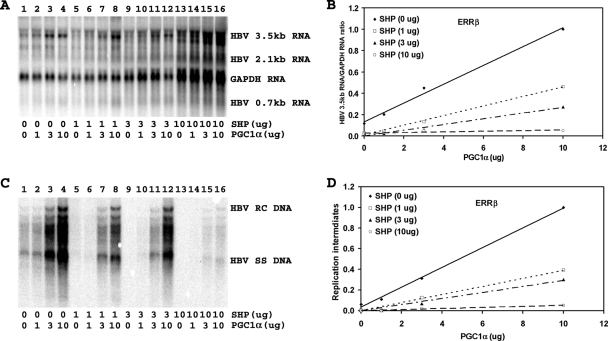
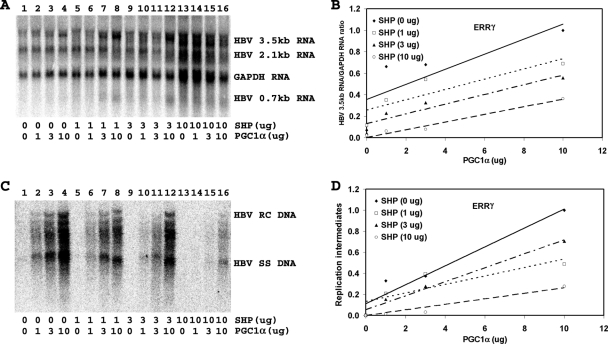
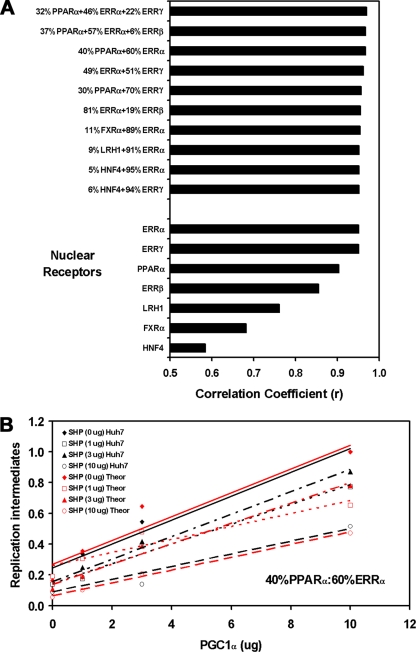
Hepatitis B virus (HBV) biosynthesis involves the transcription of the 3.5-kb viral pregenomic RNA, followed by its reverse transcription into viral DNA. Consequently, the modulation of viral transcription influences the level of virus production. Nuclear receptors are the only transcription factors known to support viral pregenomic RNA transcription and replication. The coactivator peroxisome proliferator-activated receptor gamma coactivator 1alpha (PGC1alpha) and corepressor small heterodimer partner (SHP) have central roles in regulating energy homeostasis in the liver by modulating the transcriptional activities of nuclear receptors. Therefore, the effect of PGC1alpha and SHP on HBV transcription and replication mediated by nuclear receptors was examined in the context of individual nuclear receptors in nonhepatoma cells and in hepatoma cells. This analysis indicated that viral replication mediated by hepatocyte nuclear factor 4alpha, retinoid X receptor alpha (RXRalpha) plus peroxisome proliferator-activated receptor alpha (PPARalpha), and estrogen-related receptor (ERR) displayed differential sensitivity to PGC1alpha activation and SHP inhibition. The effects of PGC1alpha and SHP on viral biosynthesis in the human hepatoma cell line Huh7 were similar to those observed in the nonhepatoma cells expressing ERRalpha and ERRgamma. This suggests that these nuclear receptors, potentially in combination with RXRalpha plus PPARalpha, may have a major role in governing HBV transcription and replication in this cell line. Additionally, this functional approach may help to distinguish the transcription factors in various liver cells governing viral biosynthesis under a variety of physiologically relevant conditions.
Figures

Similar articles
-
Role of peroxisome proliferator-activated receptor gamma coactivator 1alpha in AKT/PKB-mediated inhibition of hepatitis B virus biosynthesis.J Virol. 2011 Nov;85(22):11891-900. doi: 10.1128/JVI.00832-11. Epub 2011 Aug 31. J Virol. 2011. PMID: 21880746 Free PMC article.
-
Distinct regulation of hepatitis B virus biosynthesis by peroxisome proliferator-activated receptor gamma coactivator 1alpha and small heterodimer partner in human hepatoma cell lines.J Virol. 2009 Dec;83(23):12545-51. doi: 10.1128/JVI.01624-09. Epub 2009 Sep 30. J Virol. 2009. PMID: 19793803 Free PMC article.
-
Differential inhibition of nuclear hormone receptor-dependent hepatitis B virus replication by the small heterodimer partner.J Virol. 2008 Apr;82(8):3814-21. doi: 10.1128/JVI.02507-07. Epub 2008 Jan 30. J Virol. 2008. PMID: 18234786 Free PMC article.
-
PGC1α Transcriptional Adaptor Function Governs Hepatitis B Virus Replication by Controlling HBcAg/p21 Protein-Mediated Capsid Formation.J Virol. 2017 Sep 27;91(20):e00790-17. doi: 10.1128/JVI.00790-17. Print 2017 Oct 15. J Virol. 2017. PMID: 28768874 Free PMC article.
-
Peroxisome proliferator activated receptor-alpha (PPARα) and PPAR gamma coactivator-1alpha (PGC-1α) regulation of cardiac metabolism in diabetes.Pediatr Cardiol. 2011 Mar;32(3):323-8. doi: 10.1007/s00246-011-9889-8. Epub 2011 Feb 2. Pediatr Cardiol. 2011. PMID: 21286700 Free PMC article. Review.
Cited by
-
Selective effect of β-catenin on nuclear receptor-dependent hepatitis B virus transcription and replication.Virology. 2022 Jun;571:52-58. doi: 10.1016/j.virol.2022.04.006. Epub 2022 Apr 29. Virology. 2022. PMID: 35509137 Free PMC article.
-
Independent activation of hepatitis B virus biosynthesis by retinoids, peroxisome proliferators, and bile acids.J Virol. 2013 Jan;87(2):991-7. doi: 10.1128/JVI.01562-12. Epub 2012 Nov 7. J Virol. 2013. PMID: 23135717 Free PMC article.
-
GCN5 acetyltransferase inhibits PGC1α-induced hepatitis B virus biosynthesis.Virol Sin. 2013 Aug;28(4):216-22. doi: 10.1007/s12250-013-3344-3. Epub 2013 Jul 2. Virol Sin. 2013. PMID: 23913178 Free PMC article.
-
CRTC2 enhances HBV transcription and replication by inducing PGC1α expression.Virol J. 2014 Feb 14;11:30. doi: 10.1186/1743-422X-11-30. Virol J. 2014. PMID: 24529027 Free PMC article.
-
Role of peroxisome proliferator-activated receptor gamma coactivator 1alpha in AKT/PKB-mediated inhibition of hepatitis B virus biosynthesis.J Virol. 2011 Nov;85(22):11891-900. doi: 10.1128/JVI.00832-11. Epub 2011 Aug 31. J Virol. 2011. PMID: 21880746 Free PMC article.
References
-
- Bavner, A., S. Sanyal, J. A. Gustafsson, and E. Treuter. 2005. Transcriptional corepression by SHP: molecular mechanisms and physiological consequences. Trends Endocrinol. Metab. 16:478-488. - PubMed
-
- Bonnelye, E., J. M. Vanacker, T. Dittmar, A. Begue, X. Desbiens, D. T. Denhardt, J. E. Aubin, V. Laudet, and B. Fournier. 1997. The ERR-1 orphan receptor is a transcriptional activator expressed during bone development. Mol. Endocrinol. 11:905-916. - PubMed
-
- Bookout, A. L., Y. Jeong, M. Downes, R. M. Evans, and D. J. Mangelsdorf. 2005. Tissue-specific expression patterns of nuclear receptors. NURSA www.nursa.org/10.1621/datasets.02001. - DOI
-
- Chen, D., G. Lepar, and B. Kemper. 1994. A transcriptional regulatory element common to a large family of hepatic cytochrome P450 genes is a functional binding site of the orphan receptor HNF-4. J. Biol. Chem. 269:5420-5427. - PubMed
Publication types
MeSH terms
Substances
Grants and funding
LinkOut - more resources
Full Text Sources
