. 2009 Nov;136(21):3557-66.
doi: 10.1242/dev.036335. Epub 2009 Sep 30.

BMP7 promotes proliferation of nephron progenitor cells via a JNK-dependent mechanism

Affiliations

BMP7 promotes proliferation of nephron progenitor cells via a JNK-dependent mechanism

Ulrika Blank et al. Development. 2009 Nov.

Abstract

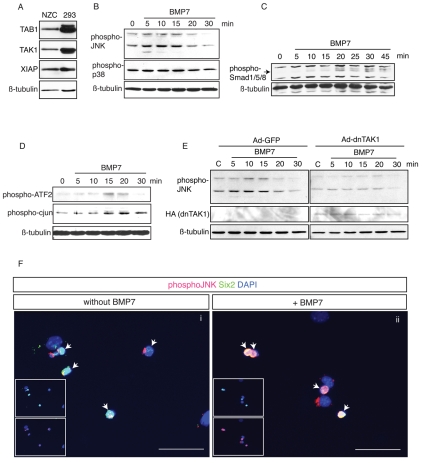
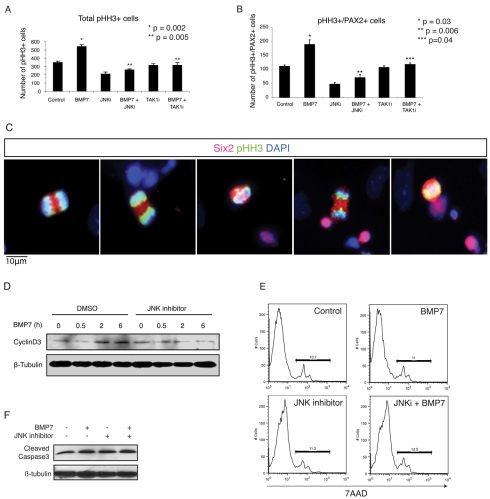
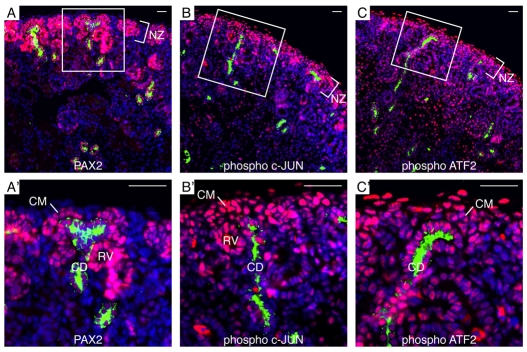
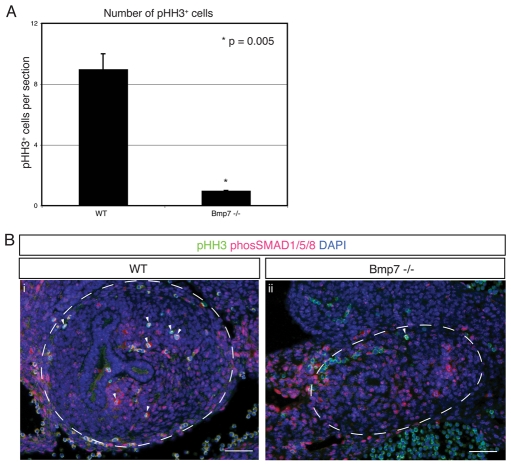
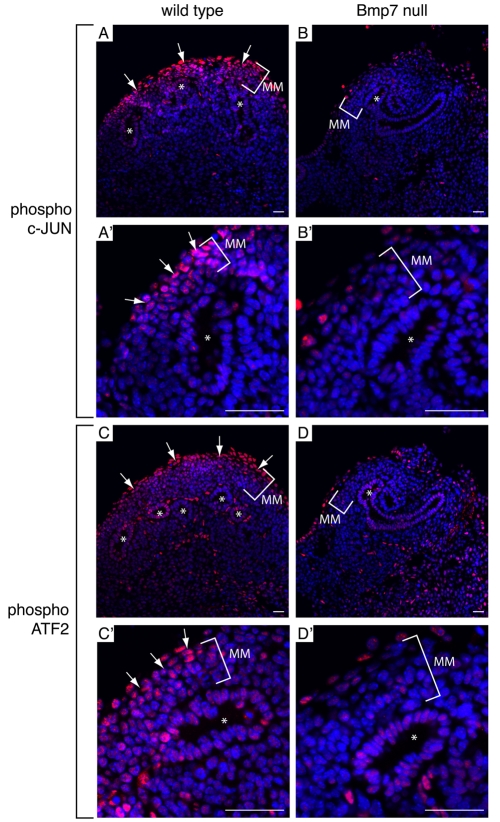
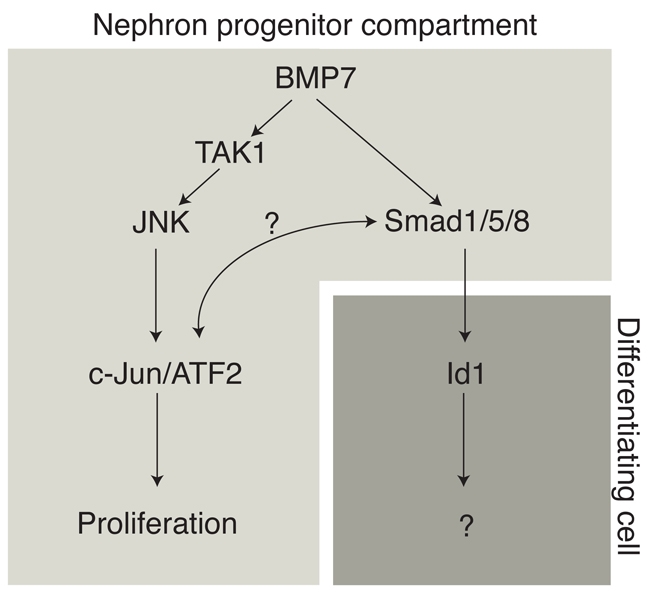
The iterative formation of nephrons during embryonic development relies on continual replenishment of progenitor cells throughout nephrogenesis. Defining molecular mechanisms that maintain and regulate this progenitor pool is essential to understanding nephrogenesis in developmental and regenerative contexts. Maintenance of nephron progenitors is absolutely dependent on BMP7 signaling, and Bmp7-null mice exhibit rapid loss of progenitors. However, the signal transduction machinery operating downstream of BMP7 as well as the precise target cell remain undefined. Using a novel primary progenitor isolation system, we have investigated signal transduction and biological outcomes elicited by BMP7. We find that BMP7 directly and rapidly activates JNK signaling in nephron progenitors resulting in phosphorylation of Jun and ATF2 transcription factors. This signaling results in the accumulation of cyclin D3 and subsequent proliferation of PAX2(+) progenitors, inversely correlating with the loss of nephron progenitors seen in the Bmp7-null kidney. Activation of Jun and ATF2 is severely diminished in Bmp7-null kidneys, providing an important in vivo correlate. BMP7 thus promotes proliferation directly in nephron progenitors by activating the JNK signaling circuitry.


Figures

Fig. 1.
Fig. 1.
Characterization of the NZ cell population from E17.5 embryonic kidneys. (A) Schematic representation of the E17.5 mouse kidney and the major cell populations of the NZ. Cell compartments of mouse reporter strains expressing β-galactosidase are shown in blue and YFP is shown in yellow. CM, cap mesenchyme; CD, collecting duct; NZ, nephrogenic zone. (B) Flow cytometry of NZ cells. (C) Representative flow cytometry histogram showing 70.7% YFP+ cells among NZ cells from Bmp7+/cre;R26-YFP. (D) Representative flow cytometry revealing <0.04% YFP+ collecting duct cells among NZ cells from HoxB7-Cre;R26-YFP. (E) Intact collecting duct tips of residual kidneys from Bmp7+/lacZ embryos following NZ cell isolation. The residual kidneys were stained in X-gal solution. LacZ+ collecting ducts are blue. (F) Representative flow cytometry of 7AAD-stained NZ cells showing 94.8% viable cells. (G) NZ cell purity at harvest. Numbers represent average percentage values ± s.d. YFP indicates positive cells from Bmp7+/cre;R26-YFP (n=3), Bmp7+ cells were calculated from Bmp7+/lacZ (n=3), Foxd1+ cells were calculated from Foxd1+/lacZ (n=3). 7AAD+ indicates percentage of dead cells (n=5). (H) Immunofluorescence (IF) staining of NZ cells following 16 hours of culture. SIX2-labeled cells are shown in red, nuclei are stained blue with DAPI. Scale bars: 50 μm. (I) IF staining of NZ cells after 16 hours of culture showing overlap between SIX2 (red) and PAX2 (green) expression. Insets show individual color channels. DAPI counterstain (blue) shows nuclei. Scale bar: 50 μm.
Fig. 2.
Fig. 2.
NZ cells recapitulate characteristics of BMP-signaling in the nephrogenic zone. (A) Western blot analysis of phosphorylated SMAD1/SMAD5/SMAD8 in NZ cells stimulated with or without 50 ng/ml BMP7 for 30 minutes. NZ cells were pre-incubated overnight with or without 20 μM dorsomorphin, a BMP-specific inhibitor, as indicated. β-tubulin was used as a loading control. (B) IF staining of NZ cells using anti-phospho-SMAD1/SMAD5/SMAD8 (red) in conjunction with anti-SIX2 (green). DAPI was used as nuclear stain. NZ cells were incubated without (i) or with 50 ng/ml BMP7 (ii) for 30 minutes. Note extensive signaling in both SIX2+ and SIX2- populations. Scale bars: 50 μm. (C) IF staining of WT kidney section at E17.5. White lines indicate the NZ. Phospho-SMAD1/SMAD5/SMAD8 (red); phospho-HH3 (pHH3; green); DAPI (blue) stains nuclei. Note weak nuclear phospho-SMAD1/SMAD5/SMAD8 throughout the NZ. Scale bar: 50 μm. (D) Quantitative RT-PCR of Id1 expression in NZ cells and MEFs stimulated with 50 ng/ml BMP7 for 6 hours. Values are normalized to β-actin and represented as fold increase relative to unstimulated cells. Average values ± s.d. (NZ cell, n=5; MEF, n=1). (E) NZ cells harvested from BMP-reporter embryos were stimulated without (i) or with 50 ng/ml BMP7 (ii) for 16 hours. β-galactosidase+ cells (blue) indicate cells actively responding to BMP by SMAD-mediated transcriptional activation. Insets show magnifications of representative fields for each condition. Black arrows indicate responding β-galactosidase+ cells with epithelial- or stromal-like morphology. White arrows denote non-responding progenitor cells.
Fig. 3.
Fig. 3.
BMP7 activates JNK signaling in SIX2+ NZ cells. (A) Western blot analysis showing expression of TAB1, TAK1 and XIAP in NZ cells. HEK293 cell lysate was used as a positive control (Blonska et al., 2005; Dan et al., 2004; Ge et al., 2003). β-tubulin shows protein loading. (B) Western blot analyses of activated JNK and p38 in NZ cells stimulated with 50 ng/ml BMP7 for 5-30 minutes. β-tubulin was used as loading control. (C) Western blot analysis of phosphorylated SMAD1/5/8 in NZ cells stimulated with 50 ng/ml BMP7 for 5-45 minutes. β-tubulin shows protein loading. (D) Western blot analyses of phosphorylated forms of Jun and ATF2 in NZ cells stimulated with 50 ng/ml BMP7 for 5-30 minutes. β-tubulin was used as loading control. (E) Western blot analyses of NZ cells transduced with control GFP- or dominant-negative (dn) TAK1 adenoviral (Ad) vectors. Cells were stimulated with 50 ng/ml BMP7 for 5-30 minutes and subsequently analyzed for phosphorylated JNK. Lane C, unstimulated control. HA-tagged dnTAK1 was detected using anti-HA antibody. β-tubulin was used as loading control. (F) IF staining of unstimulated NZ cells (i) or stimulated with 50 ng/ml BMP7 for 10 minutes (ii). Phosphorylated JNK (red), SIX2 (green), DAPI (blue). Arrows indicate SIX2+ cells, which robustly activate the JNK pathway upon BMP7 stimulation. Scale bars: 50 μm.
Fig. 4.
Fig. 4.
BMP7 promotes proliferation of PAX2+ NZ cells. (A) Number of mitotic phospho-histone H3 (phospho-HH3)-positive cells are shown normalized to total number of cells in each treatment group. Values represent averages ± s.e.m. (n=3). Analysis was carried out after 16-18 hours of stimulation. *P=0.002 for control versus BMP7-treated samples. **P=0.005 for BMP7 treated versus BMP7+JNK inhibitor or BMP7+TAK1 inhibitor treated samples. (B) Number of phospho-HH3+ PAX2+ cells normalized to total cell numbers in each treatment group. Values represent averages ± s.e.m. (n=3). Analysis was carried out after 16-18 hours of stimulation. *P=0.03 for control versus BMP7-treated samples. **P=0.006 for BMP7-treated versus BMP7+JNK inhibitor-treated samples. ***P=0.04 for BMP7-treated versus BMP7+TAK1 inhibitor-treated samples. (C) Representative images of stained NZ cells, revealing that SIX2+ (red) cells proliferate (phospho-HH3+, green) after 16-18 hours of BMP7 stimulation. DAPI stained nuclei are blue. Scale bar: 10 μm. (D) Western blot analysis of NZ cells reveals upregulation of cyclin D3 after 2 and 6 hours of BMP7 exposure. Addition of JNK inhibitor eliminates the increase in cyclin D3 in response to BMP7. β-tubulin was used as loading control. (E) Representative FACS analyses of 7AAD-stained NZ cells following 16-18 hours of stimulation, as indicated. No significant difference in the contribution of 7AAD+ dead cells could be detected between treatment groups. (F) Western blot analysis of cleaved caspase-3 in NZ cells following 16-18 hours of stimulation as indicated. β-tubulin was used as loading control.
Fig. 5.
Fig. 5.
Activated Jun and ATF2 localize to cap mesenchyme in the E17.5 kidney. Representative IF staining of E17.5 WT kidneys. DAPI counterstain shows nuclei (blue). (A,A′) Pax2 (red), DBA lectin (green). PAX2+ DBA- cells indicate cap mesenchyme (CM) adjacent to DBA+ collecting duct (CD) tips. (B,B′) Phosphorylated Jun (red); DBA lectin (green). (C,C′) Phosphorylated ATF2 (red); DBA lectin (green). Nuclear staining of both activated Jun and ATF2 is present in cap mesenchyme adjacent to collecting duct tips. NZ, nephrogenic zone; RV, renal vesicle. Scale bars: 50 μm.
Fig. 6.
Fig. 6.
Decreased proliferation but maintained phosphorylation of SMAD1/SMAD5/SMAD8 in Bmp7-null kidneys. (A) Number of mitotic phospho-HH3+ cells per kidney section at E12.5 (n=3). Values are shown as average ± s.d. Phospho-HH3+ cells in collecting ducts were excluded. Bmp7-null kidneys exhibit a significant reduction in phospho-HH3+ cells compared with WT littermates (P=0.005). (B) Representative IF staining of E12.5 WT (i) and Bmp7-null (ii) kidneys. Phospho-HH3+ (green); phospho-SMAD1/SMAD5/SMAD8 (red); DAPI stained nuclei (blue). Kidneys are outlined with a dashed line. Arrowheads indicate mitotic phospho-HH3+/phospho-SMAD1/SMAD5/SMAD8+ cells. Note the absence of phospho-HH3+ cells in the Bmp7-null kidney. Scale bars: 50 μm.
Fig. 7.
Fig. 7.
Impaired activation of Jun and ATF2 in Bmp7 null kidneys. Representative IF staining of E12.5 (A,A',C,C') WT and (B,B',D,D') Bmp7-null kidneys. (A-B') Phospho-Jun (red). (C-D') Phospho-ATF2 (red). Arrows indicate regions of intense nuclear staining. Asterisks indicate collecting duct tips. MM, metanephric mesenchyme. DAPI stained nuclei are blue. Scale bars: 50 μm.
Fig. 8.
Fig. 8.
Model of BMP7 signaling in the NZ. BMP7 preferentially functions through the JNK signaling pathway to promote proliferation in the nephron progenitor compartment. The SMAD machinery is silent at the transcriptional level in cap mesenchyme, but becomes increasingly activated as cells progress to the renal vesicle stage and beyond.

References

    1. Bakiri, L., Lallemand, D., Bossy-Wetzel, E. and Yaniv, M. (2000). Cell cycle-dependent variations in c-Jun and JunB phosphorylation: a role in the control of cyclin D1 expression. EMBO J. 19, 2056-2068. - PMC - PubMed
    1. Behrens, A., Sibilia, M., David, J. P., Mohle-Steinlein, U., Tronche, F., Schutz, G. and Wagner, E. F. (2002). Impaired postnatal hepatocyte proliferation and liver regeneration in mice lacking c-jun in the liver. EMBO J. 21, 1782-1790. - PMC - PubMed
    1. Blank, U., Seto, M. L., Adams, D. C., Wojchowski, D. M., Karolak, M. J. and Oxburgh, L. (2008). An in vivo reporter of BMP signaling in organogenesis reveals targets in the developing kidney. BMC Dev. Biol. 8, 86. - PMC - PubMed
    1. Blonska, M., Shambharkar, P. B., Kobayashi, M., Zhang, D., Sakurai, H., Su, B. and Lin, X. (2005). TAK1 is recruited to the tumor necrosis factor-alpha (TNF-alpha) receptor 1 complex in a receptor-interacting protein (RIP)-dependent manner and cooperates with MEKK3 leading to NF-kappaB activation. J. Biol. Chem. 280, 43056-43063. - PubMed
    1. Brunskill, E. W., Aronow, B. J., Georgas, K., Rumballe, B., Valerius, M. T., Aronow, J., Kaimal, V., Jegga, A. G., Grimmond, S., McMahon, A. P. et al. (2008). Atlas of gene expression in the developing kidney at microanatomic resolution. Dev. Cell 15, 781-791. - PMC - PubMed

Publication types