

Expression of glucose-dependent insulinotropic polypeptide in the zebrafish
- PMID: 19793957
- PMCID: PMC2803629
- DOI: 10.1152/ajpregu.00288.2009
Expression of glucose-dependent insulinotropic polypeptide in the zebrafish
Abstract
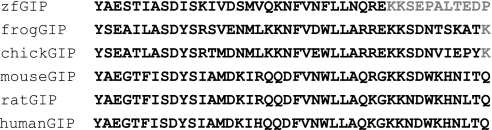
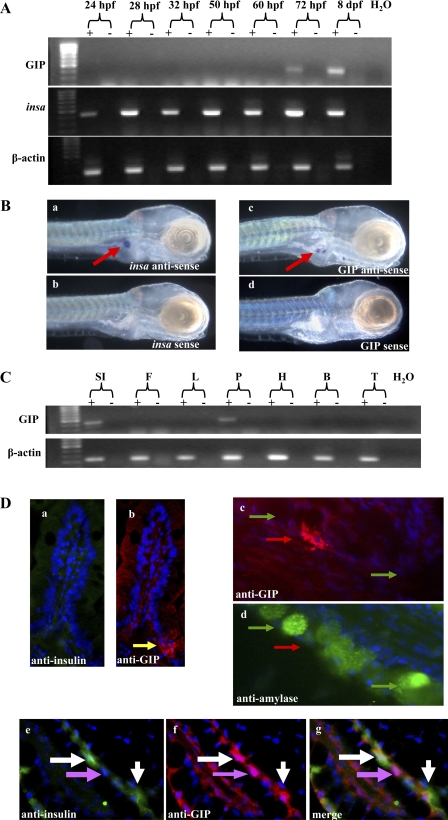
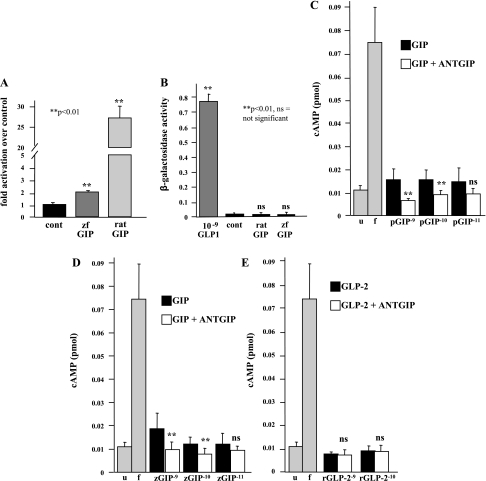
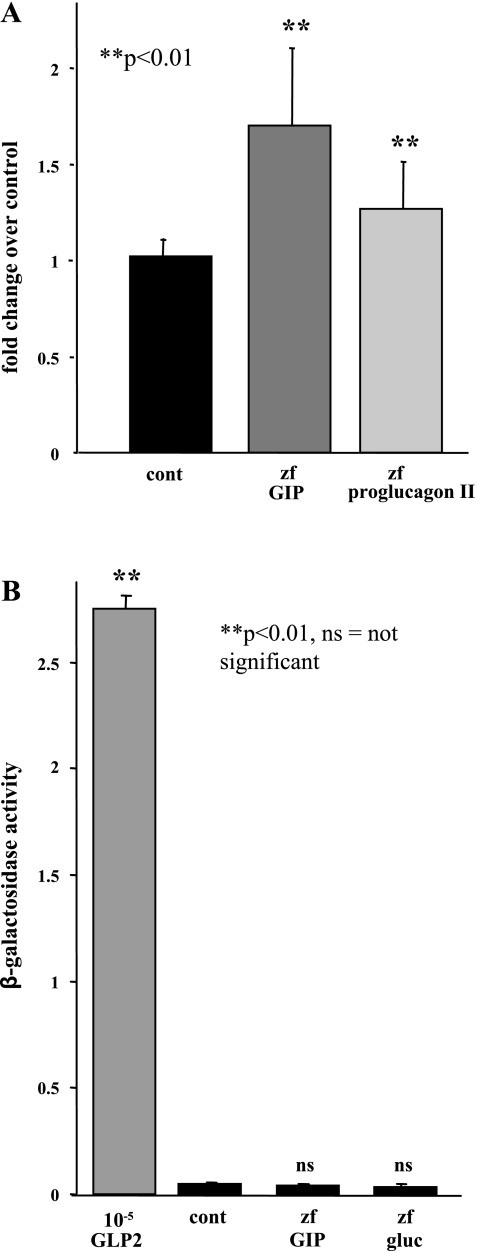
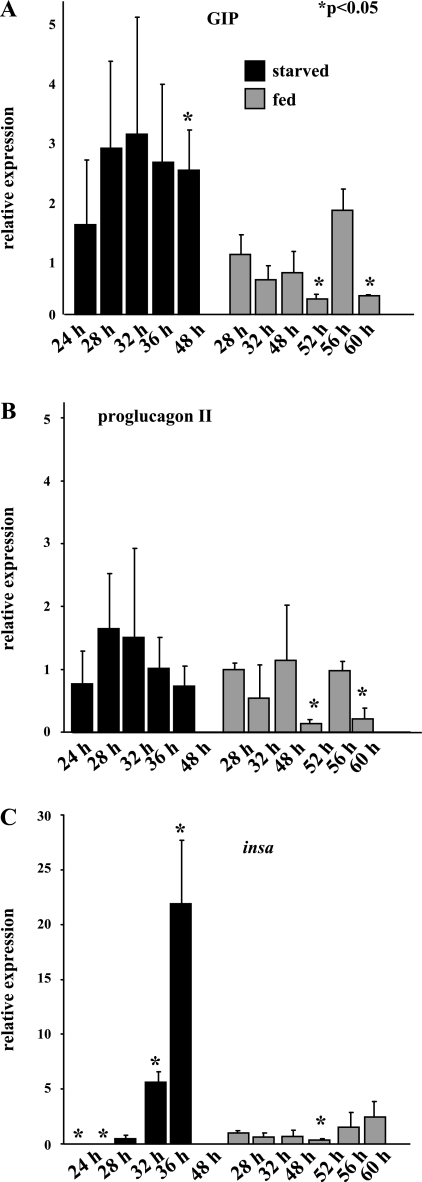
In mammals, glucose-dependent insulinotropic polypeptide (GIP) is synthesized predominately in the small intestine and functions in conjunction with insulin to promote nutrient deposition. However, little is known regarding GIP expression and function in early vertebrates like the zebrafish, a model organism representing an early stage in the evolutionary development of the compound vertebrate pancreas. Analysis of GIP and insulin (insa) expression in zebrafish larvae by RT-PCR demonstrated that although insa was detected as early as 24 h postfertilization (hpf), GIP expression was not demonstrated until 72 hpf, shortly after the completion of endocrine pancreatic development but prior to the commencement of independent feeding. Furthermore, whole mount in situ hybridization of zebrafish larvae showed expression of GIP and insa in the same tissues, and in adult zebrafish, RT-PCR and immunohistochemistry demonstrated GIP expression in both the intestine and the pancreas. Receptor activation studies showed that zebrafish GIP was capable of activating the rat GIP receptor. Although previous studies have identified four receptors with glucagon receptor-like sequences in the zebrafish, one of which possesses the capacity to bind GIP, a functional analysis of these receptors has not been performed. This study demonstrates interactions between the latter receptor and zebrafish GIP, identifying it as a potential in vivo target for the ligand. Finally, food deprivation studies in larvae demonstrated an increase in GIP and proglucagon II mRNA levels in response to fasting. In conclusion, the results of these studies suggest that although the zebrafish appears to be a model of an early stage of evolutionary development of GIP expression, the peptide may not possess incretin properties in this species.
Figures
Similar articles
-
Evolutionary expression of glucose-dependent-insulinotropic polypeptide (GIP).Regul Pept. 2011 Nov 10;171(1-3):26-34. doi: 10.1016/j.regpep.2011.06.001. Epub 2011 Jul 1. Regul Pept. 2011. PMID: 21723886
-
The expression and function of glucose-dependent insulinotropic polypeptide in the embryonic mouse pancreas.Diabetes. 2011 Feb;60(2):548-54. doi: 10.2337/db09-0035. Diabetes. 2011. PMID: 21270265 Free PMC article.
-
Glucose-dependent insulinotropic polypeptide is expressed in pancreatic islet alpha-cells and promotes insulin secretion.Gastroenterology. 2010 May;138(5):1966-75. doi: 10.1053/j.gastro.2010.01.049. Epub 2010 Feb 4. Gastroenterology. 2010. PMID: 20138041
-
Glucose-dependent Insulinotropic Polypeptide (GIP): From prohormone to actions in endocrine pancreas and adipose tissue.Dan Med Bull. 2011 Dec;58(12):B4368. Dan Med Bull. 2011. PMID: 22142579 Review.
-
Glucose-dependent insulinotropic polypeptide (Gastric Inhibitory Polypeptide; GIP).Vitam Horm. 2009;80:409-71. doi: 10.1016/S0083-6729(08)00615-8. Vitam Horm. 2009. PMID: 19251046 Review.
Cited by
-
Glucose-Dependent Insulinotropic Polypeptide Suppresses Foam Cell Formation of Macrophages through Inhibition of the Cyclin-Dependent Kinase 5-CD36 Pathway.Biomedicines. 2021 Jul 16;9(7):832. doi: 10.3390/biomedicines9070832. Biomedicines. 2021. PMID: 34356896 Free PMC article.
-
Glucose metabolism in fish: a review.J Comp Physiol B. 2012 Dec;182(8):1015-45. doi: 10.1007/s00360-012-0658-7. Epub 2012 Apr 5. J Comp Physiol B. 2012. PMID: 22476584 Review.
-
Evolutionary conservation of glucose-dependent insulinotropic polypeptide (GIP) gene regulation and the enteroinsular axis.Regul Pept. 2010 Sep 24;164(2-3):97-104. doi: 10.1016/j.regpep.2010.05.007. Epub 2010 Jun 2. Regul Pept. 2010. PMID: 20621665 Free PMC article.
-
In vivo drug discovery for increasing incretin-expressing cells identifies DYRK inhibitors that reinforce the enteroendocrine system.Cell Chem Biol. 2022 Sep 15;29(9):1368-1380.e5. doi: 10.1016/j.chembiol.2022.08.001. Epub 2022 Aug 22. Cell Chem Biol. 2022. PMID: 35998625 Free PMC article.
-
In vivo monitoring of intracellular Ca2+ dynamics in the pancreatic β-cells of zebrafish embryos.Islets. 2018;10(6):221-238. doi: 10.1080/19382014.2018.1540234. Epub 2018 Dec 6. Islets. 2018. PMID: 30521410 Free PMC article.
References
-
- Brown JC, Dryburgh JR. A gastric inhibitory polypeptide. II. The complete amino acid sequence. Can J Biochem 49: 867– 872, 1971 - PubMed
-
- Buchan AM, Polak JM, Capella C, Solcia E, Pearse AG. Electronimmunocytochemical evidence for the K cell localization of gastric inhibitory polypeptide (GIP) in man. Histochemistry 56: 37– 44, 1978 - PubMed
-
- Cardoso J, Power D, Clark M. Comparative study of family 2 GPCRs in Fugu rubripes. Ann NY Acad Sci 1040: 257– 260, 2005 - PubMed
-
- Carr RD, Larsen MO, Winzell MS, Jelic K, Lindgren O, Deacon CF, Ahren B. Incretin and islet hormonal responses to fat and protein ingestion in healthy men. Am J Physiol Endocrinol Metab 295: E779– E784, 2008 - PubMed
Publication types
MeSH terms
Substances
Grants and funding
LinkOut - more resources
Full Text Sources
Molecular Biology Databases