. 2009 Dec;297(6):R1749-60.
doi: 10.1152/ajpregu.00461.2009. Epub 2009 Sep 30.

Development of obesity in the Otsuka Long-Evans Tokushima Fatty rat

Affiliations

Development of obesity in the Otsuka Long-Evans Tokushima Fatty rat

Mariana Schroeder et al. Am J Physiol Regul Integr Comp Physiol. 2009 Dec.

Abstract

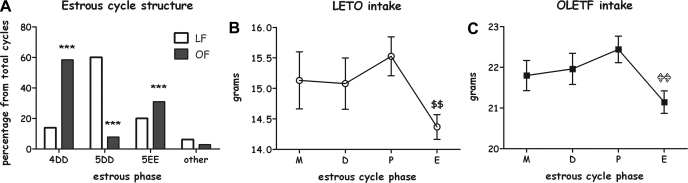
Understanding the early factors affecting obesity development in males and females may help to prevent obesity and may lead to the discovery of more effective treatments for those already obese. The Otsuka Long-Evans Tokushima Fatty (OLETF) rat model of obesity is characterized by hyperphagia-induced obesity, due to a spontaneous lack of CCK(1) receptors. In the present study, we focused on the behavioral and physiological aspects of obesity development from weaning to adulthood. We examined body weight, feeding efficiency, fat pad [brown, retroperitoneal, inguinal and epydidimal (in males)] weight, inguinal adipocyte size and number, leptin and oxytocin levels, body mass index, waist circumference, and females' estrous cycle structure. In the males, central hypothalamic gene expression was also examined. OLETF rats presented overall higher fat and leptin levels, larger adipocytes, and increased waist circumference and BMI from weaning until adulthood, compared with controls. Analysis of developmental patterns of gene expression for hypothalamic neuropeptides revealed peptide-specific patterns that may underlie or be a consequence of the obesity development. Analysis of the developmental trajectories toward obesity within the OLETF strain revealed that OLETF females developed obesity in a more gradual manner than the males, presenting delayed obesity-related "turning points," with reduced adipocyte size but larger postweaning fat pads and increased adipocyte hyperplasia compared with the males. Intake decrease in estrus vs. proestrus was significantly less in OLETF vs. Long-Evans Tokushima Otsuka females. The findings highlight the importance of using different sex-appropriate approaches to increase the efficacy of therapeutic interventions in the treatment and prevention of chronic early-onset obesity.


Figures

Fig. 1.
Fig. 1.
A: Otsuka Long-Evans Tokushima Fatty (OLETF) and Long-Evans Tokushima Otsuka (LETO) rats' body weight in grams on postnatal day (PND) 22, 38, 48, 65, 90 (both sexes), and 120 (only females). B: OLETF and LETO rats' daily caloric intake from PND 22 until PND 90 (males) and PND 120 (females). At all ages and within each sex, OLETF rats ate significantly more than LETO controls (P < 0.001). In addition, OLETF males ate regularly significantly more than OLETF females starting from PND 32, and LETO males ate significantly more than LETO females starting from PND 38 (P < 0.05). C: OLETF and LETO rats' feeding efficiency from PND 22 to PND 90. Data are presented as means ± SE. OM, OLETF male; LM, LETO male; LF, LETO female; OF, OLETF female. *P < 0.05 for the females; #P < 0.05 for the males (for strain differences at each age); n = 8–18 per group.
Fig. 2.
Fig. 2.
OLETF and LETO rats' fats [expressed as a percentage of body weight (BW)] on PND 22, 38, 48, 65, 90 (both sexes), and 120 (only females). Inguinal fat pad (A), retroperitoneal fat pad (B), epididymal white fat (only males) (C), and brown adipose tissue (D). Data are presented in means ± SE. *P < 0.05 for the females; #P < 0.05 for the males (for strain differences at each age); aP < 0.05 for sex differences within the OLETF strain; +P < 0.05 for sex differences within the LETO strain; n = 7–12 per group.
Fig. 3.
Fig. 3.
Adipocyte size (A) and number (B) of OLETF and LETO males and females on PND 22, 38, 48, 65, 90 (both sexes), and 120 (only females). Data are presented in means ± SE. *P < 0.05 for the females; #P < 0.05 for the males (for strain differences at each age); aP < 0.05 for sex difference within the OLETF strain; +P < 0.05 for sex difference within the LETO strain; n = 4–6 per group.
Fig. 4.
Fig. 4.
Plasma leptin (A), oxytocin (B), and glucose (C) levels of OLETF and LETO males and females on PND 22, 38, 48, 65, 90 (both sexes), and 120 (only females). Data are presented as means ± SE. *P < 0.05 for the females; #P < 0.05 for the males (for strain differences at each age); aP < 0.05 for sex difference within the OLETF strain; n = 4–6 per group.
Fig. 5.
Fig. 5.
OLETF and LETO females' estrous cycle structure (A). 4DD, 4-day cycle; 5DD, 5-day cycle with double diestrous; and 5EE, 5-day cycle with double estrous. Data are presented in percentages of total cycles examined. B: twenty-four-hour intake across the estrous cycle of LETO females; LETO females displayed an 8.9% decrease in food intake during the estrous phase compared with the proestrous phase of their cycle ($$P < 0.01). C: twenty-four-hour intake across the estrous cycle of OLETF females. Compared with LETO rats, OLETF females displayed a significantly smaller (4.4%) decrease in estrous vs. proestrous food intake (P < 0.05). ***P < 0.001 for strain differences. $$P < 0.01 within the LETO strain (significantly different from the proestrous phase). P < 0.01 within the OLETF strain (significantly different from the proestrous phase). Data are presented as means ± SE; n = 11 LETO, 17 OLETF.
Fig. 6.
Fig. 6.
Representative pictures of brain slices examined for mRNA levels by in situ hybridization in LETO and OLETF male rats from PND 7 to 65.
Fig. 7.
Fig. 7.
Relative mRNA levels of hypothalamic neuropeptides in OLETF and LETO males from PND 7 to 65. Data are presented in means ± SE; n = 4–8 per group. A: levels of NPY in the ARC. B: levels of NPY in the DMH. C: levels of POMC in the ARC. D: levels of CRF in the PVN. $P < 0.05 within the LETO strain (significantly different from all other ages); formula image
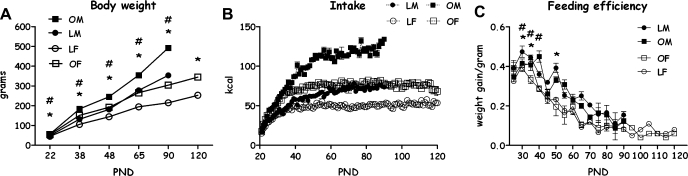
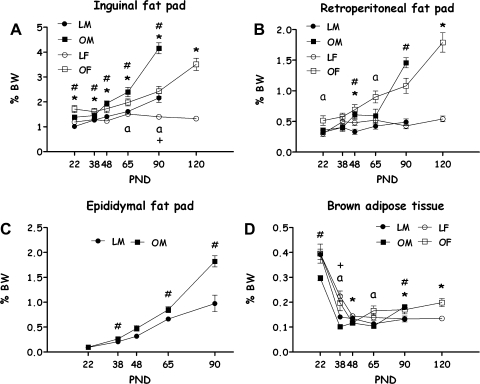
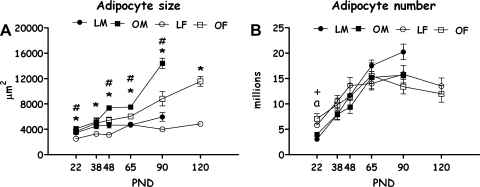
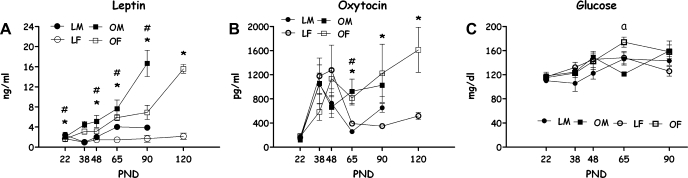
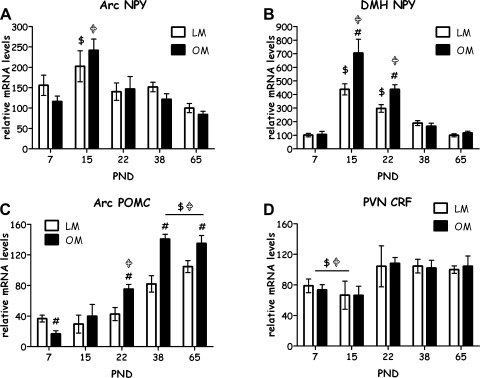
P < 0.05 within the OLETF strain (significantly different from all other ages); #P < 0.05 for strain differences.

References

    1. Applegate EA, Upton DE, Stern JS. Food intake, body composition and blood lipids following treadmill exercise in male and female rats. Physiol Behav 28: 917– 920, 1982 - PubMed
    1. Asarian L, Geary N. Modulation of appetite by gonadal steroid hormones. Philos Trans R Soc Lond B Biol Sci 361: 1251– 1263, 2006 - PMC - PubMed
    1. Ashwell M, Priest P, Bondoux M, Sowter C, McPherson CK. Human fat cell sizing—a quick, simple method. J Lipid Res 17: 190– 192, 1976 - PubMed
    1. Bays H, Blonde L, Rosenson R. Adiposopathy: how do diet, exercise and weight loss drug therapies improve metabolic disease in overweight patients? Expert Rev Cardiovasc Ther 4: 871– 895, 2006 - PubMed
    1. Bays HE, Gonzalez-Campoy JM, Bray GA, Kitabchi AE, Bergman DA, Schorr AB, Rodbard HW, Henry RR. Pathogenic potential of adipose tissue and metabolic consequences of adipocyte hypertrophy and increased visceral adiposity. Expert Rev Cardiovasc Ther 6: 343– 368, 2008 - PubMed

Publication types

MeSH terms