Comparative Study
. 2009 Sep 30;29(39):12101-14.
doi: 10.1523/JNEUROSCI.3384-09.2009.

Mitochondrial Ca2+ cycling facilitates activation of the transcription factor NFAT in sensory neurons

Affiliations
Comparative Study

Mitochondrial Ca2+ cycling facilitates activation of the transcription factor NFAT in sensory neurons

Man-Su Kim et al. J Neurosci. .

Abstract

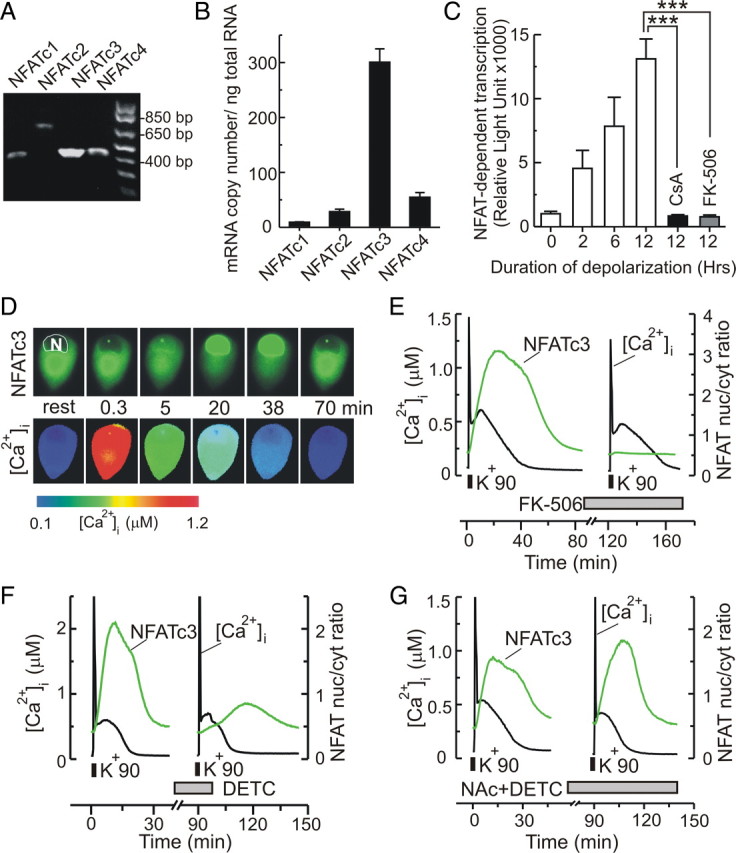
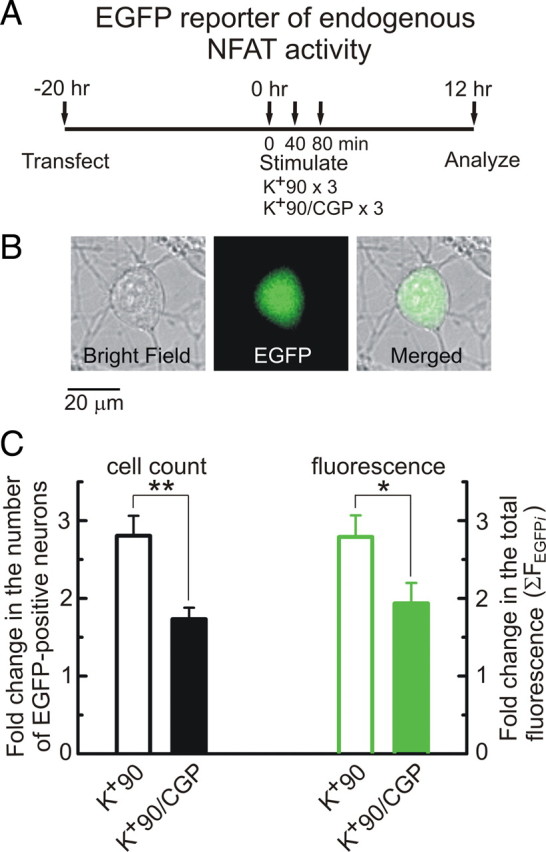
Ca(2+)-dependent gene regulation controls many aspects of neuronal plasticity. Significant progress has been made toward understanding the roles of voltage- and ligand-gated Ca(2+) channels in triggering specific transcriptional responses. In contrast, the functional importance of Ca(2+) buffers and Ca(2+) transporters in neuronal gene regulation is less clear despite their critical contribution to the spatiotemporal control of Ca(2+) signals. Here we examined the role of mitochondrial Ca(2+) uptake and release in regulating the Ca(2+)-dependent transcription factor NFAT (nuclear factor of activated T-cells), which has been implicated in synaptic plasticity, axonal growth, and neuronal survival. Intense stimulation of sensory neurons by action potentials or TRPV1 agonists induced rapid activation and nuclear import of NFAT. Nuclear translocation of NFAT was associated with a characteristic prolonged [Ca(2+)](i) elevation (plateau) that resulted from Ca(2+) uptake by, and its subsequent release from, mitochondria. Measurements using a mitochondrial Ca(2+) indicator, mtPericam, showed that this process recruited mitochondria throughout the cell body, including the perinuclear region. [Ca(2+)](i) levels attained during the plateau phase were similar to or higher than those required for NFAT activation (200-300 nm). The elimination of the [Ca(2+)](i) plateau by blocking either mitochondrial Ca(2+) uptake via the uniporter or Ca(2+) release via the mitochondrial Na(+)/Ca(2+) exchanger strongly reduced nuclear import of NFAT. Furthermore, preventing Ca(2+) mobilization via the mitochondrial Na(+)/Ca(2+) exchanger diminished NFAT-mediated transcription. Collectively, these data implicate activity-induced Ca(2+) uptake and prolonged release from mitochondria as a novel regulatory mechanism in neuronal excitation-transcription coupling.


Figures

Figure 1.
Figure 1.
Expression and pharmacological characterization of NFAT in DRG neurons. A, B, RT-PCR (A; n = 3 independent experiments) and real-time RT-PCR (B; n = 4 independent experiments) show expression of NFATc1 (also known as NFAT2), NFATc2 (also known as NFAT1), NFATc3 (also known as NFAT4), and NFATc4 (also known as NFAT3) isoforms in DRG neurons, with the highest level of mRNA detected for the NFATc3 isoform. C, Depolarization induces NFAT-mediated luciferase expression in DRG neurons. Cells were either left untreated (control) or stimulated with 20 mm KCl for 2, 6, or 12 h (indicated under the graph) in the absence (white) or presence of the calcineurin inhibitors cyclosporin A (CsA; 1 μm; black) and FK-506 (200 nm; gray). Luciferase expression is shown in relative light units (mean ± SEM). Each data point represents 4–10 independent experiments. ***p < 0.001, one-way ANOVA with Bonferroni's post hoc test. D, [Ca2+]i changes and GFP-NFATc3 nuclear translocation were simultaneously monitored in a DRG neuron stimulated with K+90 (3 min). Images show spatial distribution of GFP-NFATc3 (top) and [Ca2+]i (bottom, color-coded) either at rest or at various times after stimulation with K+90. N, Cell nucleus. E, Simultaneous recording of GFP-NFATc3 nuclear import (green) and [Ca2+]i (black) in DRG neurons stimulated with K+90 (30 s) in the absence or presence of the calcineurin inhibitor FK-506 (120 min between K+90-induced depolarizations). Treatment with 200 nm FK-506 prevented nuclear import of NFATc3 but had no effect on the [Ca2+]i signal. Nuclear translocation of GFP-NFATc3 was quantified by calculating the mean nuclear/cytosolic ratio of GFP fluorescence. F, G, Simultaneous imaging of [Ca2+]i changes (black) and GFP-NFATc3 nuclear import (green) in response to K+90-induced depolarization (30 s) in the absence (control) or presence of agents that modulate the intracellular concentration of superoxide radicals (O2). K+90-induced depolarizations were separated by 90 min. Treatment with the SOD inhibitor diethyldithiocarbamic acid (DETC, 2 mm) strongly reduced nuclear import of NFATc3 evoked by K+90 (n = 6; F), and 5 mm DETC completely blocked NFATc3 translocation (n = 5; data not shown). The O2 scavenger NAc (5 mm) prevented the inhibitory effect of 2 mm DETC (n = 7; G). However, when applied alone, 5 mm NAc did not affect nuclear import of NFATc3 (n = 9). To quantify the effects of DETC and NAc on NFATc3 activation, the magnitude of GFP-NFATc3 translocation was calculated as ΔRNFAT = RpeakRrest, where Rrest and Rpeak are the nucleus/cytosol ratios of GFP-NFATc3 at rest and at the maximum of NFATc3 translocation, respectively. For each experiment, the degree of NFATc3 translocation induced by the second K+90 application (ΔR2NFAT) was normalized to that induced by the first K+90 pulse (ΔR1NFAT). The ΔR2NFATR1NFAT ratios were 81 ± 5% for control conditions (n = 7; no additional treatments), 44 ± 13% for 2 mm DETC (n = 6, p < 0.05), 1.3 ± 0.2% for 5 mm DETC (n = 5, p < 0.01), and 75 ± 7% for 5 mm NAc (n = 9, p > 0.05); one-way ANOVA with Bonferroni's post-test relative to control. For the combined application of 2 mm DETC plus 5 mm NAc, the ΔR2NFATR1NFAT ratio was 134 ± 12% (n = 7), which is significantly different from the effect of 2 mm DETC applied alone (p < 0.001; one-way ANOVA with Bonferroni's post test).
Figure 2.
Figure 2.
Bursts of action potentials and TRPV1 agonists activate NFAT in DRG neurons. A–D, Simultaneous recording of GFP-NFATc3 movement (green) and [Ca2+]i changes in the cytosol ([Ca2+]cyt; black) and in the nucleus ([Ca2+]nuc; red) in response to a single train (arrow; A) or four trains (arrows; B) of action potentials or to the TRPV1 agonists capsaicin (1 μm, 30 s; C) or NADA (5 μm, 30 s; D). Images above the traces show the corresponding distributions of [Ca2+]i (top; color-coded) and GFP-NFATc3 (bottom) at the time points indicated. [Ca2+]i images in C and D depict both GFP-NFATc3-transfected and untransfected neurons. Action potentials were evoked using extracellular field stimulation (Usachev and Thayer, 1999). E, F, Changes in mitochondrial Ca2+ concentration ([Ca2+]mt) evoked by action potentials (E, 10 Hz for 10 s; arrow) or capsaicin (F, 1 μm, 30 s; black bar) in an mtPericam-transfected DRG neuron. Images were collected at the sampling rate of 10 Hz for the first 60 s and 2 Hz for the rest of the recording (separated by the break in the trace) in E, and at 0.2 Hz for the recording in F. Differential interference contrast (DIC; top) and mtPericam fluorescence (bottom; λex = 410 nm) images of the studied cell are shown on left. Color- and number-coded traces show [Ca2+]mt changes in the areas outlined by red boxes. N, Nuclear region.
Figure 3.
Figure 3.
Quantification of NFAT activation as a function of [Ca2+]i in DRG neurons. A, Simultaneous recording of GFP-NFATc3 nuclear import (green) and [Ca2+]i changes (black) in a DRG neuron in response to incremental depolarization caused by raising the extracellular K+ concentration ([K+]o) from 5 mm to 10, 15, 20, and 25 mm. K+10-, K+15-, K+20-, and K+25-containing solutions were supplemented with the L-type Ca2+ channel agonist BayK8644 (1 μm). B, [Ca2+]i elevation (black) and nuclear translocation of GFP-NFATc3 (green) in a DRG neuron were induced by prolonged application of 20 mm KCl (K+20; gray bar) combined with 1 μm BayK8644. DRG neurons were transfected with GFP-NFATc3 and subsequently loaded with fura-2, as described in Materials and Methods. C, Plot summarizes depolarization-induced peak [Ca2+]i elevations (red circles; mean ± SEM) and the maximal GFP-NFATc3 nuclear/cytosolic ratios attained upon NFATc3 translocation to the nucleus (open vertical bars; mean ± SEM). Cells were stimulated with K+10-, K+15-, K+20-, or K+25-containing solutions using protocols similar to that described for B. Black bars summarize the maximal GFP-NFATc3 nuclear/cytosolic ratios achieved upon NFATc3 translocation to the nucleus in similar experiments, with the exception that DRG neurons were not loaded with fura-2 (− Fura-2). D, Quantification of the rate of GFP-NFATc3 nuclear import in response to K+10-, K+15-, K+20-, or K+25-induced depolarizations. Data were obtained from the experiments like that shown in B using DRG neurons that either were loaded (empty bars) or were not loaded (black bars) with fura-2. The rate was determined by fitting the initial 5 min of the NFATc3 response with a linear function and by calculating its slope. Depolarizations using K+10-, K+15-, K+20-, or K+25-containing solutions are indicated under the plots. E, NFAT-mediated expression of luciferase was induced by 10, 15, 20, or 25 mm KCl for 12 h and was analyzed using the Promega dual-luciferase protocol (white bars; mean ± SEM). Each bar represents 3–24 independent experiments. In parallel experiments, [Ca2+]i changes were induced by 10, 15, 20, or 25 mm KCl under similar conditions (cell culture medium supplemented with 20 mm HEPES, pH = 7.4, temperature = 37°C). For both sets of experiments, K+10-, K+15-, K+20-, and K+25-containing solutions were supplemented with 1 μm BayK8644. [Ca2+]i measurements were taken after 2 (black circles), 7 (red circles), or 12 (green circles) h of treatment using the corresponding high-K+-containing buffers. Each point represents 23–103 neurons. Inset, Representative [Ca2+]i recording from multiple DRG neurons in the presence of 15 mm KCl. F, NFAT reporter expression is plotted as a function of the [Ca2+]i level using data from E. For each depolarization condition, NFAT-luciferase expression is plotted versus three [Ca2+]i measurements that were taken at 2 (black), 7 (red), and 12 (green) h after the beginning of high-K+ stimulation. Data points were fitted with sigmoid function (smooth curve) using Sigma Plot 9.1 software.
Figure 4.
Figure 4.
Mitochondria facilitate NFAT activation induced by strong depolarization. A–C, Combined monitoring of GFP-NFATc3 (green) translocation and [Ca2+]i changes in the cytosol ([Ca2+]cyt; black) and in the nucleus ([Ca2+]nuc; red) in response to two subsequent K+90-induced depolarizations (30 s, 90 min apart). In B and C, DRG neurons were treated with either 1 μm antimycin and 5 μm oligomycin (B; Ant/Ol; white bar; 10 min pretreatment) or 10 μm CGP37157 (C; gray bar) during the second depolarization. Images above the trace show GFP-NFATc3 distribution at rest and at the peak of NFATc3 nuclear translocation during each depolarization. D, Summary of the effects of the Ant/Ol and CGP37157 treatments on the magnitude of NFATc3 translocation (ΔRNFAT = RpeakRrest, where Rrest and Rpeak are GFP-NFATc3 nuclear/cytosolic ratios at rest and at the maximum of NFATc3 translocation, respectively) and on the duration of the [Ca2+]i responses (ΔT[Ca]; calculated at the 250 nm [Ca2+]i) in experiments such as those described in A–C. The effects were quantified by calculating the ΔR2NFATR1NFAT and ΔT2[Ca]T1[Ca] ratios in control experiments (black bars; no additional treatment) and in experiments in which the cells were treated with either Ant/Ol (white bars) or CGP37157 (gray bars) during the second depolarization. *p < 0.05, **p < 0.01, one-way ANOVA with Bonferroni's post hoc test.
Figure 5.
Figure 5.
Mitochondrial Ca2+ release facilitates transcriptional response mediated by endogenous NFAT. A, Description of the experimental timeline. DRG neurons were transfected with the NFAT-EGFP reporter construct and stimulated 20 h later using three K+90 depolarizations (3 min each, 40 min apart) either without (K+90) or with (K+90/CGP) additional treatment by CGP37157. CGP37157 (3 μm) was applied for 32 min between the stimuli (with 5 min wash before a sequential K+90 depolarization). EGFP-positive DRG neurons were counted and analyzed after additional 12 h in culture. B, Bright-field (left), fluorescent (middle), and merged (right) images of a DRG neuron transfected with the NFAT-EGFP reporter and stimulated with 90 mm KCl. The images were taken 12 h after the stimulation. C, Summary of the CGP37157 effects on depolarization-induced EGFP expression quantified by counting the number of EGFP-positive DRG neurons (black) and the total EGFP fluorescence in these neurons (green). The numbers of cells (or total EGFP fluorescence) for the K+90 and K+90/CGP treatments were normalized to that obtained from untreated control cells for each culture preparation (n = 6). *p < 0.05, **p < 0.01, Student's t test.
Figure 6.
Figure 6.
Mitochondria facilitate NFATc3 activation by action potentials and TRPV1 agonist. A–D, Simultaneous recording of GFP-NFATc3 nuclear import (green) and [Ca2+]i changes in the cytosol ([Ca2+]cyt; black) and nucleus ([Ca2+]nuc; red) in response to sequential applications of either trains of action potentials (10 Hz for 10 s, 90 min apart; arrows; A and B) or capsaicin (200 nm, 30 s, 90 min apart; black bars; C and D). Action potentials were generated using extracellular field stimulation (Usachev and Thayer, 1999). Mitochondrial Ca2+ uptake was blocked by applying 1 μm antimycin and 5 μm oligomycin (Ant/Ol; gray bars; B and D). E, Quantification of the effects of Ant/Ol (gray) on NFATc3 nuclear import (ΔR2NFATR1NFAT) and on the duration (ΔT2[Ca]T1[Ca]) of the [Ca2+]i responses induced by action potentials (AP) or capsaicin (Caps) as described for Figure 4D. *p < 0.05, **p < 0.01, ***p < 0.001, Student's t test. F, The effect of blocking Ca2+ extrusion via PMCA and Na+/Ca2+ exchanger (NCX) on [Ca2+]i changes (black) and nuclear import of GFP-NFATc3 (green) induced by trains of action potentials (10 Hz for 20 s; arrows; 30 min apart). PMCA and NCX were blocked by raising pH to 8.8 and removing Na+ (replaced with choline) in the extracellular solution, respectively. This modified extracellular solution was applied after the end of electrical stimulation (gray bar).
Figure 7.
Figure 7.
Mitochondria facilitate temporal summation of repetitive electrical activity by NFAT. A, B, Nuclear import of GFP-NFATc3 (green) and [Ca2+]i elevations (black) were evoked by repetitive trains of action potentials (10 Hz for 10 s, arrows). B, Cells were treated with 1 μm antimycin and 5 μm oligomycin (Ant/Ol; gray bars). C, The extent of GFP-NFATc3 nuclear translocation (ΔTNFAT; time between the initiation of NFATc3 nuclear import and export) was plotted as a function of the duration of [Ca2+]i elevation (calculated at the 250 nm [Ca2+]i level) for different stimulation protocols and pharmacological treatments. Squares, triangles, and circles indicate stimulation by action potentials, capsaicin, or 90 mm KCl, respectively. Empty symbols indicate control (no treatment); experiments involving inhibition of mitochondrial Ca2+ transport or Ca2+ extrusion are denoted by red or green symbols, respectively. Points were fitted with a linear function using Sigma Plot 9.1 software. D, Model summarizes the role of mitochondria in the regulation of NFAT nuclear translocation in neurons that is triggered by Ca2+ influx via voltage- or ligand-gated Ca2+ channels (VGCC and LGCC, respectively). By steadily releasing Ca2+ accumulated during neuronal stimulation, mitochondria markedly extend the elevation in [Ca2+]i required for NFAT activation beyond the short duration of stimulation.

Similar articles

Cited by

References

    1. Amberg GC, Rossow CF, Navedo MF, Santana LF. NFATc3 regulates Kv2.1 expression in arterial smooth muscle. J Biol Chem. 2004;279:47326–47334. - PubMed
    1. Aramburu J, Yaffe MB, López-Rodríguez C, Cantley LC, Hogan PG, Rao A. Affinity-driven peptide selection of an NFAT inhibitor more selective than cyclosporin A. Science. 1999;285:2129–2133. - PubMed
    1. Arron JR, Winslow MM, Polleri A, Chang CP, Wu H, Gao X, Neilson JR, Chen L, Heit JJ, Kim SK, Yamasaki N, Miyakawa T, Francke U, Graef IA, Crabtree GR. NFAT dysregulation by increased dosage of DSCR1 and DYRK1A on chromosome 21. Nature. 2006;441:595–600. - PubMed
    1. Baron KT, Thayer SA. CGP37157 modulates mitochondrial Ca2+ homeostasis in cultured rat dorsal root ganglion neurons. Eur J Pharmacol. 1997;340:295–300. - PubMed
    1. Beals CR, Sheridan CM, Turck CW, Gardner P, Crabtree GR. Nuclear export of NF-ATc enhanced by glycogen synthase kinase-3. Science. 1997;275:1930–1934. - PubMed

Publication types