Comparative Study
. 2009 Sep 30;29(39):12210-9.
doi: 10.1523/JNEUROSCI.1828-09.2009.

Functional and anatomical reorganization of the sensory-motor cortex after incomplete spinal cord injury in adult rats

Affiliations
Comparative Study

Functional and anatomical reorganization of the sensory-motor cortex after incomplete spinal cord injury in adult rats

Arko Ghosh et al. J Neurosci. .

Abstract

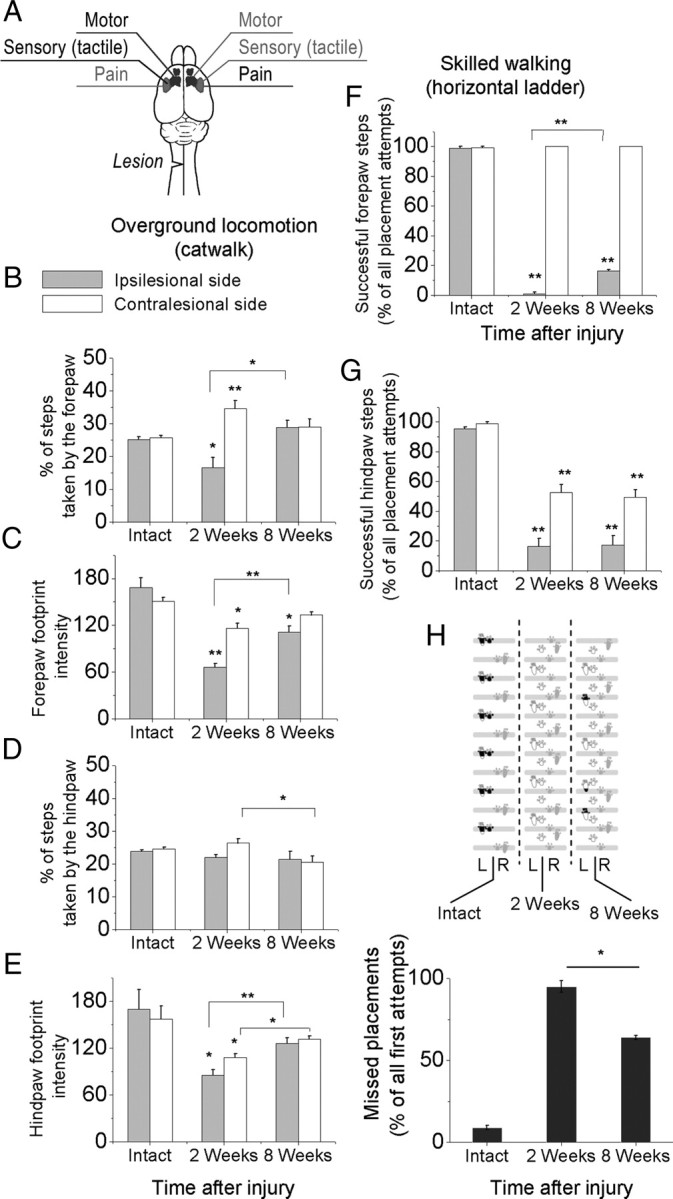
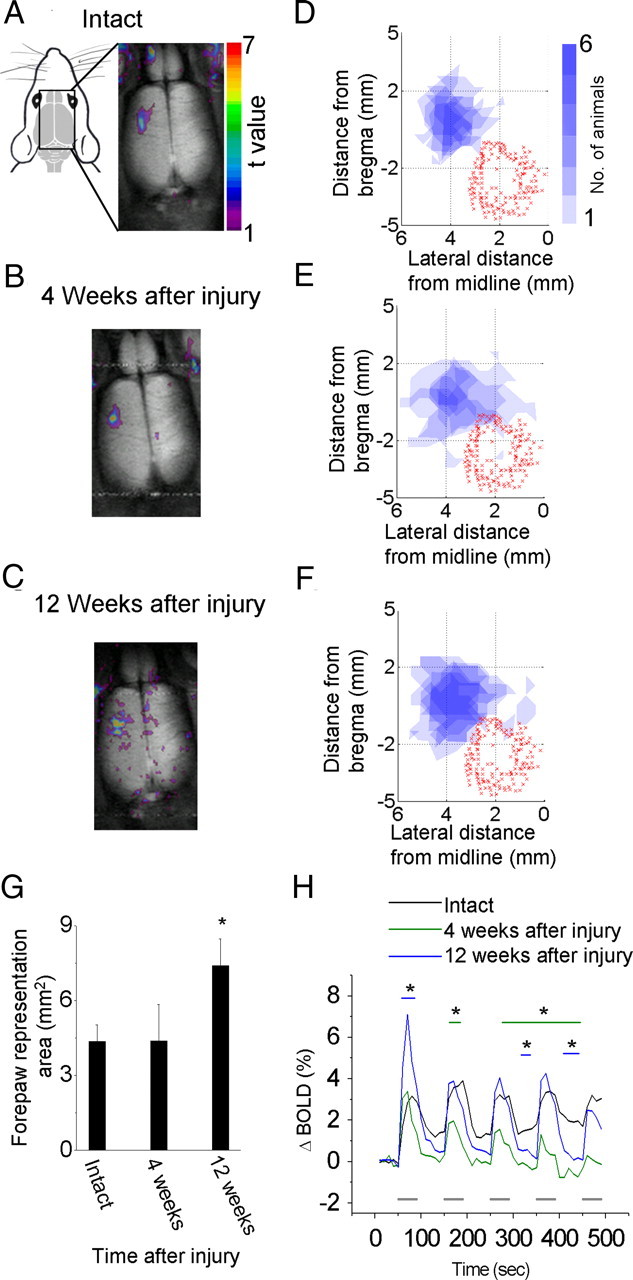
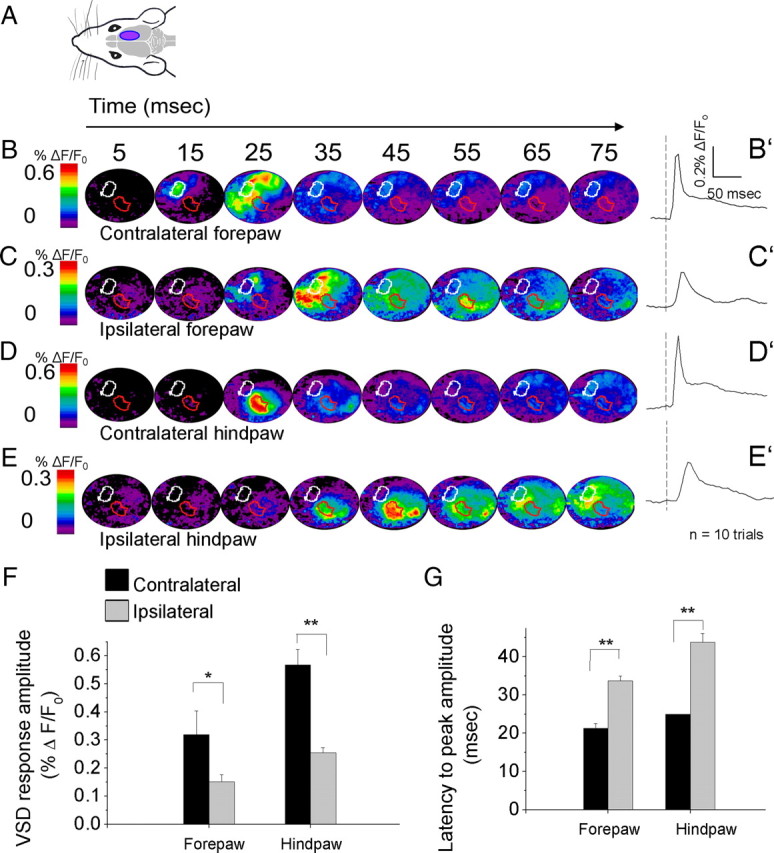
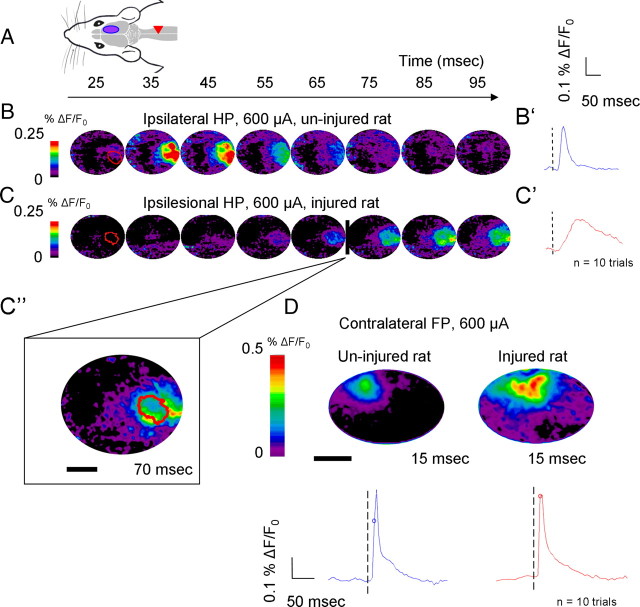
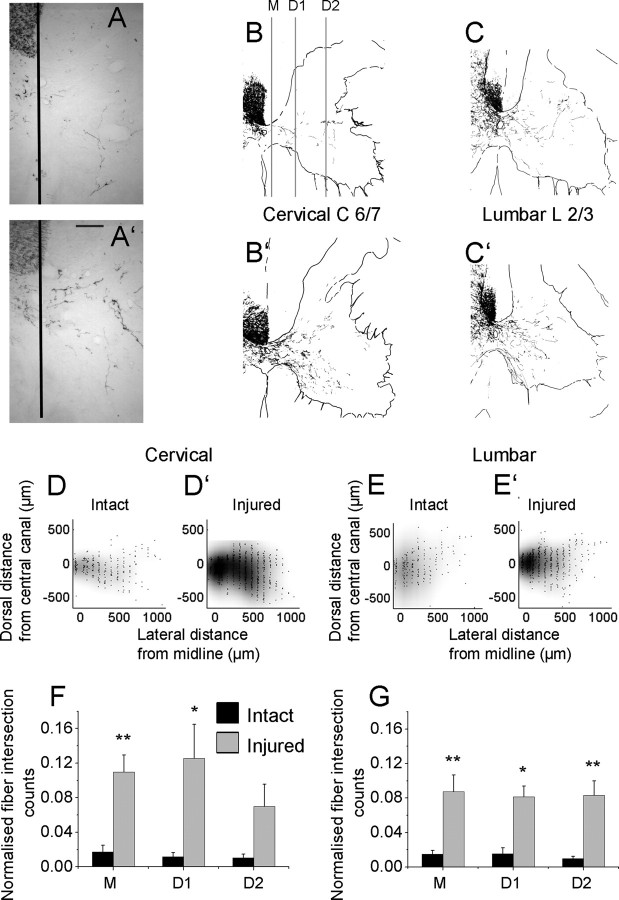
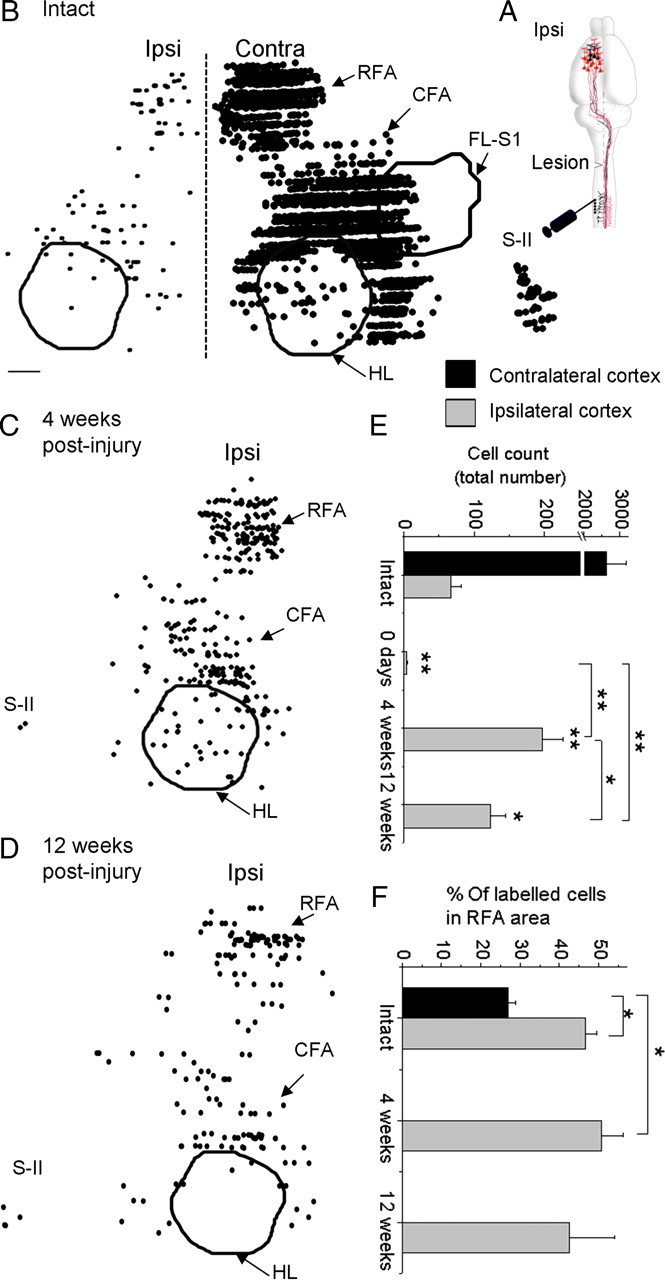
A lateral hemisection injury of the cervical spinal cord results in Brown-Séquard syndrome in humans and rats. The hands/forelimbs on the injured side are rendered permanently impaired, but the legs/hindlimbs recover locomotor functions. This is accompanied by increased use of the forelimb on the uninjured side. Nothing is known about the cortical circuits that correspond to these behavioral adaptations. In this study, on adult rats with cervical spinal cord lateral hemisection lesions (at segment C3/4), we explored the sensory representation and corticospinal projection of the intact (ipsilesional) cortex. Using blood oxygenation level-dependent functional magnetic resonance imaging and voltage-sensitive dye (VSD) imaging, we found that the cortex develops an enhanced representation of the unimpaired forepaw by 12 weeks after injury. VSD imaging also revealed the cortical spatio-temporal dynamics in response to electrical stimulation of the ipsilateral forepaw or hindpaw. Interestingly, stimulation of the ipsilesional hindpaw at 12 weeks showed a distinct activation of the hindlimb area in the intact, ipsilateral cortex, probably via the injury-spared spinothalamic pathway. Anterograde tracing of corticospinal axons from the intact cortex showed sprouting to recross the midline, innervating the spinal segments below the injury in both cervical and lumbar segments. Retrograde tracing of these midline-crossing axons from the cervical spinal cord (at segment C6/7) revealed the formation of a new ipsilateral forelimb representation in the cortex. Our results demonstrate profound reorganizations of the intact sensory-motor cortex after unilateral spinal cord injury. These changes may contribute to the behavioral adaptations, notably for the recovery of the ipsilesional hindlimb.


Figures

Figure 1.
Figure 1.
Significant recovery of overground locomotion and poor recovery of skilled movements by the ipsilesional limbs after lateral hemisection of the cervical (C3/4) spinal cord. A, Schematic view of the injury model used that leads to Brown-Séquard syndrome. Text in gray denotes absence and text in black denotes presence of input or output after the injury. B–E, While walking on a flat runway (catwalk), animals altered their walking pattern to increase their use of the contralesional forelimb at 2 weeks. B, At 8 weeks, the walking pattern recovered to normal. C, Body weight support (loading of limb, footprint intensity) for the ipsilesional forepaw showed a 2.5-fold decrease 2 weeks after injury to recover significantly by 8 weeks. D, Hindpaw rhythm after injury remained similar to preinjury baseline. E, The ipsilesional hindpaw also showed a decrease in footprint intensity at 2 weeks and a consecutive recovery 12 weeks after injury. F, G, Skilled movements, as required while walking on a horizontal ladder, remained severely and permanently affected after injury. F, The ipsilesional forepaw was unable to successfully step on the ladder after injury and showed no recovery over 8 weeks. G, The ipsilesional hindpaw was similarly affected and did not show any recovery in the number of functional placements. H, A schematic view of the first placement attempts on a ladder rung, drawn based on a rat before and after injury. L, Left (ipsilesional) forepaw and hindpaw; R, right (contralesional) forepaw and hindpaw (in gray). Horizontal ladder rungs are in gray. The area of ipsilesional paw contacts on the horizontal ladder is in black. Notably, the ipsilesional hindpaw showed significant recovery after 8 weeks in the number of attempted steps that made contact with the ladder rung and thus resulted in a decreased number of missed placements. n = 6 rats (n = 5 for H), ±SEM. Data were subjected to the nonparametric Mann–Whitney U test. *p < 0.05; **p < 0.01. Where not indicated, statistics are compared with the respective data in intact animals.
Figure 2.
Figure 2.
BOLD-fMRI reveals expansion of contralesional, unimpaired forepaw representation in the sensory-motor cortex after injury. A–C, BOLD response activation maps after electrical stimulation of the contralesional forepaw before injury (A), 4 weeks after injury (B), and 12 weeks after injury (C). D–F, Superimposed individual activation maps from intact animals (D), 4 weeks (E), and 12 weeks (F) after injury. The blue area represents the forepaw (n = 6 rats; the intensity of the color representing the number of rats displaying activation at a specific location), and red crosses show the borders of the hindpaw area in intact animals (n = 4 rats). G, Area of forepaw representation from BOLD-fMRI maps. H, Average BOLD signal change (n = 6 rats) after repeated forepaw stimulations (gray lines depict stimulus trains) reveals an increased amplitude 12 weeks after injury (ROI, original forepaw area) in response to the first stimulation train. The color of the line below the asterisk depicts the group to which the intact response curve was compared with. Statistics are as in the previous figure.
Figure 3.
Figure 3.
VSD imaging after bilateral forepaw and hindpaw electrical stimulations in uninjured animals. A, Schematic view of the imaged cortical location. B–E, Spatio-temporal dynamics of cortical responses after contralateral forepaw (B), ipsilateral forepaw (C), contralateral hindpaw (D), and ipsilateral hindpaw (E) electrical stimulation (600 μA single pulse; n = 10 trials) in an intact animal. White and red borders indicate 55% isocentric contours after forepaw stimulation (at 15 ms after stimulation) and hindpaw stimulation (at 20 ms after stimulation), respectively. B′–E′, Time activity curves of the corresponding images (with ROI based on 55% isocentric contours 5 ms after the signal appears in the cortex). The vertical dashed line depicts stimulation. F, G, The mean peak response amplitude (F) and latency to peak (G) are also shown. Note the different color scale used in B and D compared with C and E. n = 5 rats. Statistics are as in previous figures.
Figure 4.
Figure 4.
VSD imaging after stimulation of the ipsilesional hindpaw results in activation of the ipsilateral somatosensory cortex. A, Scheme of the FOV with respect to the lesion (red arrowhead). B, C, Spatio-temporal dynamics of cortical activity in the ipsilesional cortex. Stimulation of the ipsilateral hindpaw in an intact animal (B) resulted in activation at short latency. The corresponding mean time activity curve with the hindpaw cortex as the ROI (B′; n = 10 trials). Twelve weeks after injury (C), the same stimulation led to a specific but delayed activation in the ipsilateral hindlimb cortex (time activity curve; C′). The activation was specifically intense in the hindlimb field (C″). Red boundaries depict contralateral hindpaw activation field in the same animal. D, Stimulation of the unimpaired forepaw resulted in a strong initial activation 12 weeks after injury. Ovals on the corresponding time activation curves show signal amplitude measured at 15 ms after stimulation (ROI, 70% isocentric contours 20 ms after forepaw stimulation). The vertical dashed line in C′, B′, and D depicts stimulation. Scale bars, 1.5 mm.
Figure 5.
Figure 5.
Increase of midline-crossing CST axons 4 weeks after unilateral cervical spinal cord injury. A–C, BDA-labeled CST axons in intact animals rarely crossed the midline in the cervical (A, B) or lumbar (C) spinal cord. Four weeks after injury, the number of midline-crossing axons increased (A′–C′). Scale bar, 200 μm. Camera lucida drawings of midline-crossing CST axons in the cervical (B, intact; B′, injured) and lumbar (C, intact; C′, injured) segments. D, E, Midline-crossing axon innervation maps, generated from midline-crossing axon intersection points on an array of equally spaced parallel vertical lines (80 μm apart; additional two lines placed 50 μm before and after the midline) placed through the entire ipsilateral gray matter. There is a maximum projection of 40 subsequent cross sections in cervical (D, intact; D′, injured) and lumbar (E, intact; E′, injured) segments. Intensity of the gray value represents the number of sections showing midline-crossing fibers in the same region. F, G, Quantification of axon counts at 50 μm (M), 240 μm (D1), and 480–560 μm (D2) from the central canal, normalized to efficiency of tracing, confirms the observed increase in innervation of the gray matter by the ipsilateral cortex in both cervical (F) and lumbar (G) segments. n = 5 rats. Statistics are as in previous figures.
Figure 6.
Figure 6.
Retrograde localization of corticospinal neurons in the sensory-motor cortex reveals a new ipsilateral representation after lateral hemisection of the spinal cord. A, Retrograde tracer was injected in the ipsilesional spinal cord below the lesion to label the cell bodies of midline-crossing fibers. B, A dorsal view of the corticospinal representation in the contralateral and ipsilateral cortex. Each dot represents one labeled CST neuron. Representations were generated from cross sections through the cortex spaced at 100 μm. Scale bar, 500 μm. C, D, Ipsilateral CST representation 4 weeks (C) and 12 weeks (D) after injury. E, Quantification of retrogradely labeled cortical CST cells (n = 4 intact rats; n = 5 injury groups; counts from 50 μm brain sections with 100 μm gap). F, Percentage of retrogradely labeled CST cells in the given hemisphere originating from the RFA area. Statistics are as in previous figures. Ipsi, ipsilesional; Contra, contralateral; FL-S1, primary forelimb sensory area; HL, hindlimb sensory-motor area (black boundary enclosed retrogradely labeled cut CST from lower thoracic spinal cord); RFA, rostral forelimb area; CFA, caudal forelimb area; S-II, secondary somatosensory area.

Similar articles

Cited by

References

    1. Akintunde A, Buxton DF. Differential sites of origin and collateralization of corticospinal neurons in the rat: a multiple fluorescent retrograde tracer study. Brain Res. 1992;575:86–92. - PubMed
    1. Bareyre FM, Haudenschild B, Schwab ME. Long-lasting sprouting and gene expression changes induced by the monoclonal antibody IN-1 in the adult spinal cord. J Neurosci. 2002;22:7097–7110. - PMC - PubMed
    1. Bolton DA, Tse AD, Ballermann M, Misiaszek JE, Fouad K. Task specific adaptations in rat locomotion: runway versus horizontal ladder. Behav Brain Res. 2006;168:272–279. - PubMed
    1. Brown-Séquard CE. Lectures on the physiology and pathology of the nervous system; and on the treatment of organic nervous affections. Lancet. 1868;92:593.
    1. Bruehlmeier M, Dietz V, Leenders KL, Roelcke U, Missimer J, Curt A. How does the human brain deal with a spinal cord injury? Eur J Neurosci. 1998;10:3918–3922. - PubMed

Publication types