Comparative Study
. 2009 Sep 30;29(39):12315-20.
doi: 10.1523/JNEUROSCI.2575-09.2009.

Evidence for a common representation of decision values for dissimilar goods in human ventromedial prefrontal cortex

Affiliations
Comparative Study

Evidence for a common representation of decision values for dissimilar goods in human ventromedial prefrontal cortex

Vikram S Chib et al. J Neurosci. .

Abstract

To make economic choices between goods, the brain needs to compute representations of their values. A great deal of research has been performed to determine the neural correlates of value representations in the human brain. However, it is still unknown whether there exists a region of the brain that commonly encodes decision values for different types of goods, or if, in contrast, the values of different types of goods are represented in distinct brain regions. We addressed this question by scanning subjects with functional magnetic resonance imaging while they made real purchasing decisions among different categories of goods (food, nonfood consumables, and monetary gambles). We found activity in a key brain region previously implicated in encoding goal-values: the ventromedial prefrontal cortex (vmPFC) was correlated with the subjects' value for each category of good. Moreover, we found a single area in vmPFC to be correlated with the subjects' valuations for all categories of goods. Our results provide evidence that the brain encodes a "common currency" that allows for a shared valuation for different categories of goods.


Figures

Figure 1.
Figure 1.
Experimental design and behavioral results. A, Before entering the scanner, subjects judged their WTP for an 80% probability of receiving each item. Inside the scanner, subjects made choices between a reference monetary price (equal to the median WTP of all items) and an 80% chance of receiving each item. The order of item presentation was randomized. B, Group distributions of WTP for each category of item. C, Group psychometric functions for each category of item. Psychometric functions were generated from subjects' prescanning WTP measures and choices inside the scanner.
Figure 2.
Figure 2.
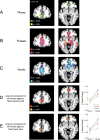
mOFC commonly encodes the DV of multiple classes of goods. A–C, The results from experiment 1 for areas correlating with our goal valuation measure separately for the money, trinket, and food conditions. Columns show areas exhibiting voxel-wise correlations with WTP (color codes depict the statistical thresholds used to display the activation). The peaks of activation are as follows: money condition: [x = −3, y = 42, z = −6], Z = 3.42; trinket condition: [x = 6, y = 39, z = 12], Z = 5.06; snack condition: [x = 3, y = 30, z = 12], Z = 5.00. D, An area of mOFC surviving a conjunction analysis testing for correlations with valuation common to all of the goods in the first experiment (for choices against a fixed monetary bid). The locus of the peak voxel from the conjunction analysis was [x = −3, y = 42, z = −6]; Z = 3.42. The right column shows the average percentage signal change in a 5 mm sphere centered on the peak coordinates from the study by Plassmann et al. (2007), ensuring the independence of this plot from the contrasts used in A–D. The average percentage signal change is shown for the lower ($0–$1) and upper ($3–$4) bounds of WTP. E, Results for the conjunction analysis for the second replication experiment in which choices were made against a fixed snack item. The peak conjunction response in this experiment was [x = −9, y = 39, z = −6]; Z = 3.57. The right column shows the average percentage signal change as a function of WTP, from a 5 mm sphere centered on the peak coordinate derived from experiment 1, ensuring the independence of this plot from the contrasts used to generate the conjunction.

Similar articles

Cited by

References

    1. Barraclough D, Conroy M, Lee D. Prefrontal cortex and decision making in a mixed-strategy game. Nat Neurosci. 2004;7:404–410. - PubMed
    1. Becker G, DeGroot M, Marschak J. Measuring utility by a single-response sequential method. Behav Sci. 1964;9:226–232. - PubMed
    1. Bernoulli D. Specimen theoriae novae de mensura sortis. Reprinted in: Econometrica. 1738;22:23–36. (Sommer L, translator), 1954.
    1. Brainard D. The psychophysics toolbox. Spat Vis. 1997;10:433–436. - PubMed
    1. Buchel C, Morris J, Dolan R, Friston K. Brain systems mediating aversive conditioning: an event-related fMRI study. Neuron. 1998;20:947–957. - PubMed

Publication types

LinkOut - more resources