Comparative Study
. 2009 Sep 30;29(39):12321-31.
doi: 10.1523/JNEUROSCI.0911-09.2009.

Human microsaccade-related visual brain responses

Affiliations
Comparative Study

Human microsaccade-related visual brain responses

Olaf Dimigen et al. J Neurosci. .

Abstract

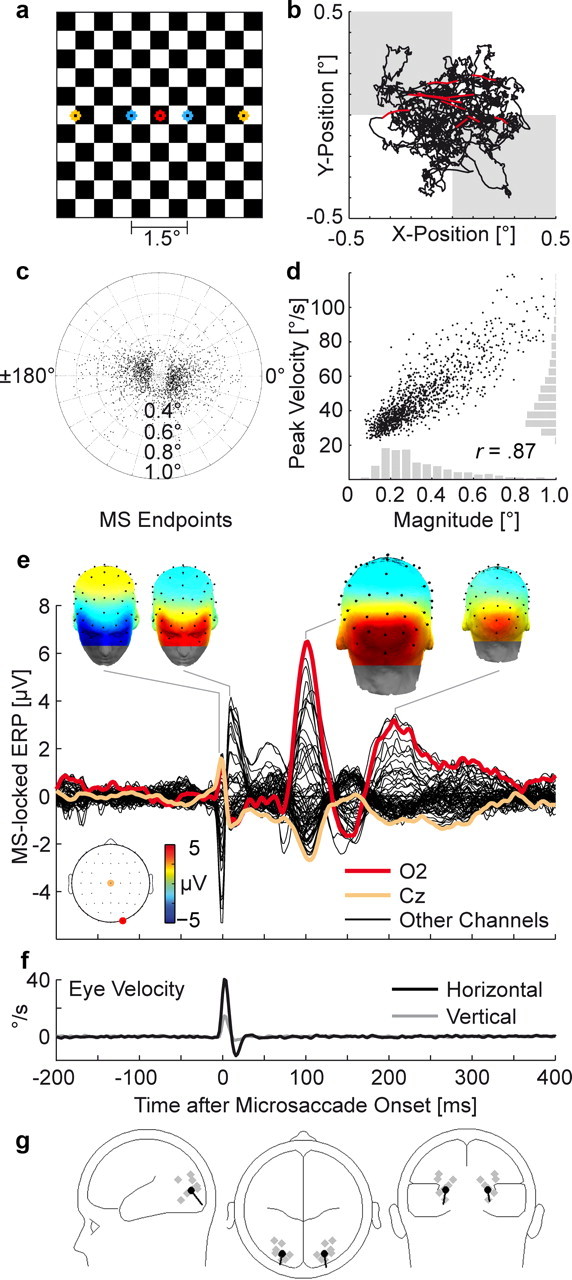
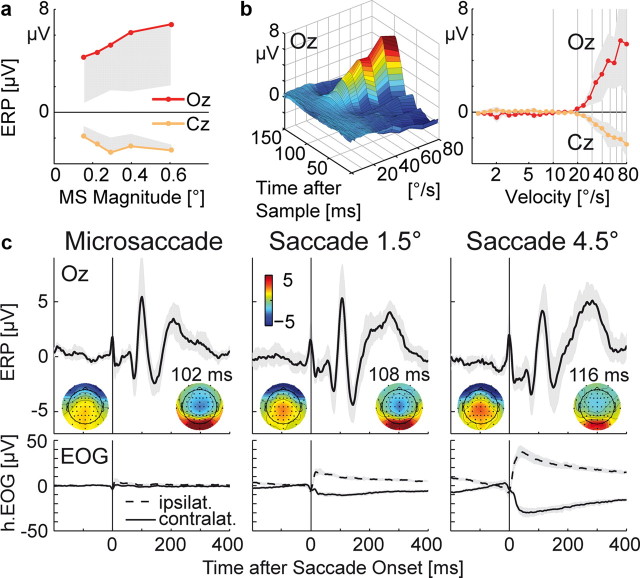
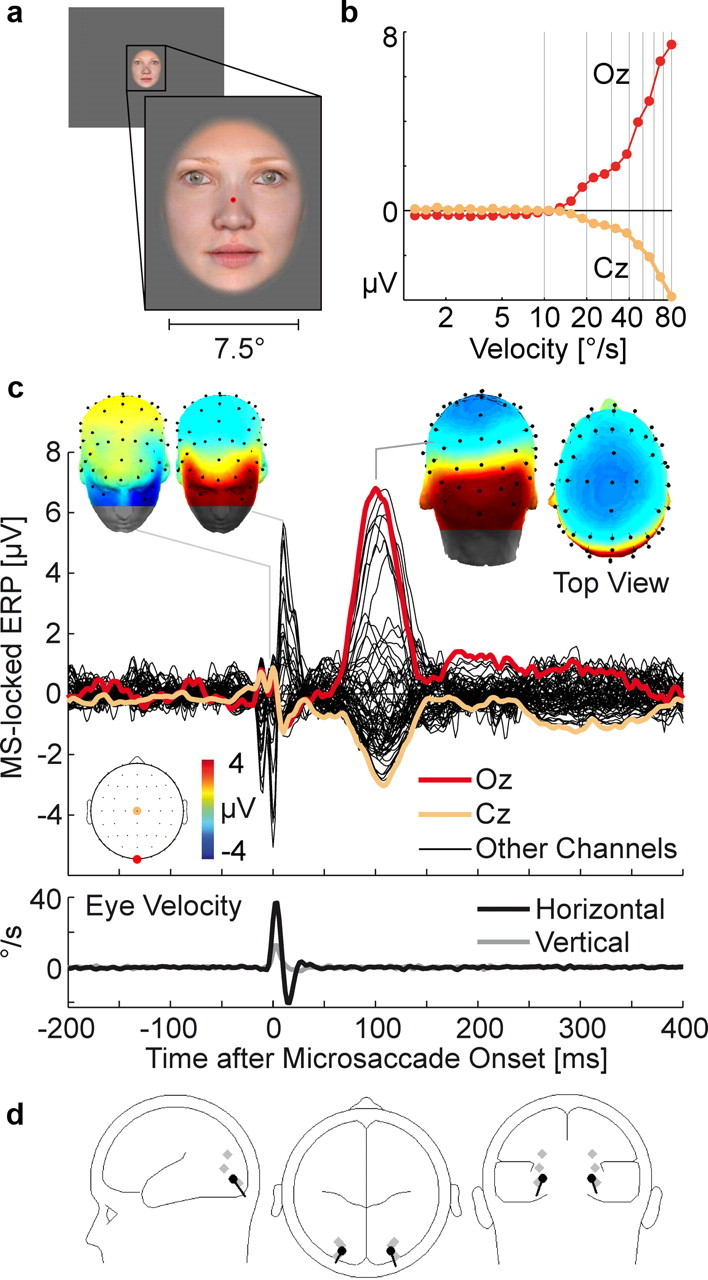
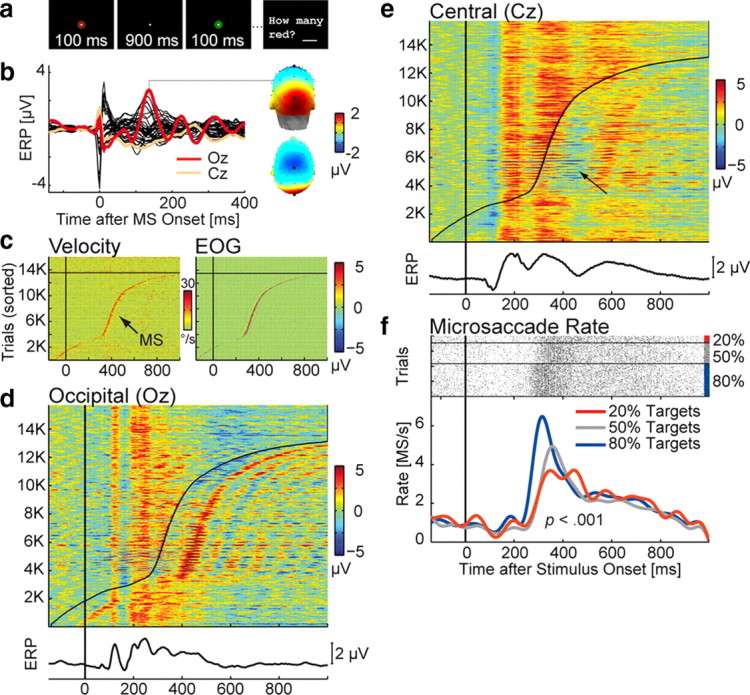
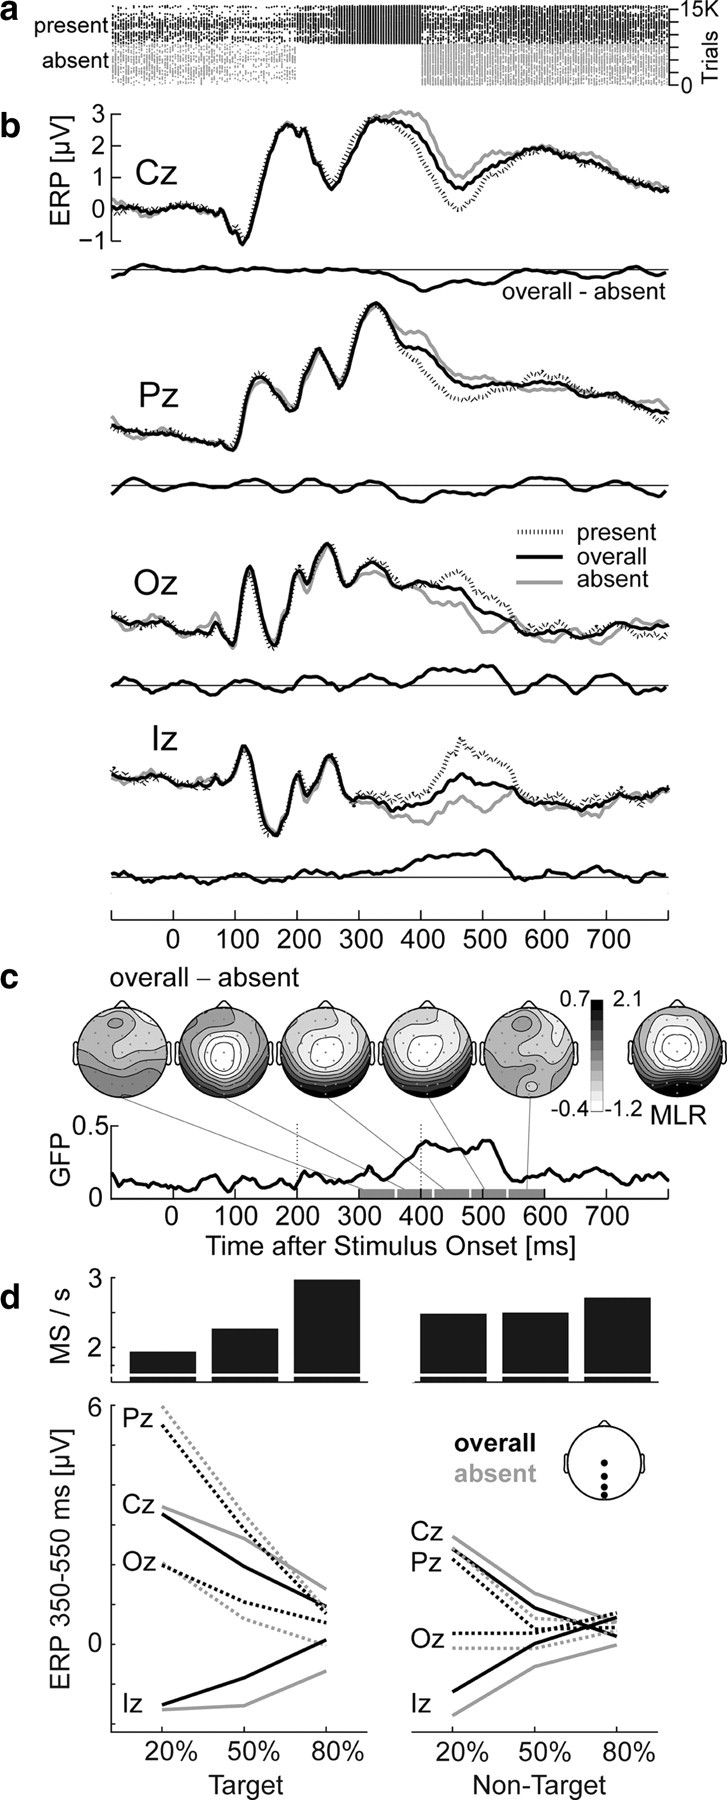
Microsaccades are very small, involuntary flicks in eye position that occur on average once or twice per second during attempted visual fixation. Microsaccades give rise to EMG eye muscle spikes that can distort the spectrum of the scalp EEG and mimic increases in gamma band power. Here we demonstrate that microsaccades are also accompanied by genuine and sizeable cortical activity, manifested in the EEG. In three experiments, high-resolution eye movements were corecorded with the EEG: during sustained fixation of checkerboard and face stimuli and in a standard visual oddball task that required the counting of target stimuli. Results show that microsaccades as small as 0.15 degrees generate a field potential over occipital cortex and midcentral scalp sites 100-140 ms after movement onset, which resembles the visual lambda response evoked by larger voluntary saccades. This challenges the standard assumption of human brain imaging studies that saccade-related brain activity is precluded by fixation, even when fully complied with. Instead, additional cortical potentials from microsaccades were present in 86% of the oddball task trials and of similar amplitude as the visual response to stimulus onset. Furthermore, microsaccade probability varied systematically according to the proportion of target stimuli in the oddball task, causing modulations of late stimulus-locked event-related potential (ERP) components. Microsaccades present an unrecognized source of visual brain signal that is of interest for vision research and may have influenced the data of many ERP and neuroimaging studies.


Figures

Figure 1.
Figure 1.
Microsaccade-related potentials during checkerboard fixation. a, Central part of the checkerboard with fixation point (red) and voluntary saccade targets (blue and yellow). b, Typical trajectory of the right eye during 10 s of attempted fixation. Data points belonging to microsaccades are plotted in red. Background shading symbolizes the checkerboard's check size. c, Spatial distribution of 1225 microsaccades. The center represents the microsaccade starting point, and dots indicate endpoints. d, Microsaccades showed the typical correlation between peak velocity and magnitude. Marginal distributions are plotted in gray. e, Grand average ERP, time-locked to microsaccade onsets (time 0). Signals at all EEG and EOG channels are plotted superimposed; electrodes over right occipital cortex (O2) and the vertex (Cz) are highlighted. Inserts show scalp distributions at selected time points. Microsaccade onset was accompanied by a biphasic muscle spike potential (SP) with periocular maxima. After 106 ms, microsaccades evoked a microsaccadic lambda response (MLR) with maxima over visual cortex and, with reversed polarity, vertex. f, Grand mean eye velocity from simultaneous eye tracking. Negative velocities represent movements against the predominant direction of the microsaccade. g, Two-source equivalent dipole model, fitted to the MLR peak. Dipole estimates for single subjects are plotted in gray.
Figure 2.
Figure 2.
Lambda response as a function of microsaccade magnitude, eye velocity, and saccade type. a, MLR amplitude after 100 ms as a function of microsaccade magnitude. Shading gives the 95% between-subject CI in one direction. b, Left, EEG voltage at occipital electrode Oz as a function of instantaneous eye velocity during fixation. Right, Voltage 100 ms after the velocity sample. Significant responses are seen after velocities >22°/s. c, Comparison of potentials evoked by microsaccades and larger voluntary saccades. Top, Electrode Oz. Inserts show scalp topographies at movement onset (0 ms) and at the peak latency of the lambda response. Note the similarity between the micro- and macrosaccadic lambda response despite large differences in saccade magnitude. Bottom, Corneoretinal artifacts are evident as a voltage difference between the horizontal EOG electrodes ipsilateral and contralateral to saccade direction. Note the small artifact for microsaccades.
Figure 3.
Figure 3.
Microsaccade-related potentials during face fixation. a, Example stimulus. b, EEG voltage as a function of instantaneous eye velocity 100 ms earlier. c, Grand average microsaccade-locked ERP. The double spike at microsaccade onset is due to an individual subject for whom the SP preceded movement onset by 10 ms. This caused a doubled SP in the grand average ERP (see supplemental Fig. S3, available at www.jneurosci.org as supplemental material). d, Dipole model at the peak of the MLR.
Figure 4.
Figure 4.
Microsaccade-related potentials in the oddball experiment. a, Trial scheme: Subjects silently counted discs of the target color. b, Grand average ERP, time-locked to the onset of microsaccades detected during experimental trials. The MLR peaked after 136 ms over visual cortex and the vertex. c, Eye velocity and EOG voltage (color-coded) in 15,732 experimental trials. Each horizontal line represents the data of one trial; Time 0 marks stimulus onset. Trials are sorted from bottom to top according to the latency of the first microsaccade detected in the trial. Trials with no microsaccade are plotted above the black line. Left, Rectified velocity of the right eye. Microsaccades are evident as a peak in eye velocity. Right, Signal at the right infraorbital EOG electrode, high-pass filtered at 30 Hz. The SP is visible as a spike at microsaccade onset. d, Sorted trials at electrode Oz. Microsaccade latency is indicated by the black line. The presence of MLRs in the stimulus-locked data becomes apparent after sorting. e, MLRs have a negative polarity at Cz. The positive-going P300 component is therefore attenuated in trials in which a microsaccade occurred 200–300 ms after stimulus onset (arrow). f, Microsaccade rate for target stimuli. Top, Each horizontal line represents one trial; microsaccades are marked with dots. Bottom, Microsaccade rate, smoothed with a 10 Hz low-pass filter for visualization. The microsaccadic rebound was significantly smaller in blocks with rare (20%) compared with blocks with frequent (80%) target stimuli.
Figure 5.
Figure 5.
Stimulus-locked ERP in the oddball experiment as a function of microsaccade occurrence between 200 and 400 ms. a, Horizontal lines represent trials; dots mark microsaccades (MS). MS-present and MS-absent trials are plotted separately. b, ERP for MS-absent trials, MS-present trials, and the overall set of trials. Central electrodes show negative and occipital electrodes positive deflections in trials with microsaccades. Difference waves compare the ERP from all trials to that from MS-absent trials only. Note that experimental conditions are equally weighted in this plot, i.e., MS-absent, MS-present, and overall ERPs were first computed in each condition, and only then collapsed across conditions. c, Scalp topography and global field power of the microsaccade effect. Its topography (shown for 60 ms intervals between 300 and 600 ms) resembled the peak topography of the MLR (shown for comparison) and its latency reflected the delay between microsaccade onset and MLR peak. d, Mean microsaccade rate (between 200 and 400 ms) and ERP amplitude (350–550 ms) for the six conditions. In addition to P300 effects of targetness and stimulus frequency, ERP distortions from microsaccades are evident at all electrodes. For nontargets, both microsaccade rate and ERP distortions were similar for rare and frequent stimuli. For targets, distortions increased with increasing microsaccade rate at occipital electrodes.

References

    1. American Electroencephalographic Society. Guideline thirteen: guidelines for standard electrode position nomenclature. J Clin Neurophysiol. 1994;11:111–113. - PubMed
    1. Armington JC, Bloom MB. Relations between the amplitudes of spontaneous saccades and visual responses. J Opt Soc Am. 1974;64:1263–1271. - PubMed
    1. Armington JC, Gaarder K, Schick AML. Variation of spontaneous ocular and occipital responses with stimulus patterns. J Opt Soc Am. 1967;57:1534–1539. - PubMed
    1. Bach M. The Freiburg Visual Acuity Test—automatic measurement of visual acuity. Optom Vis Sci. 1996;73:49–53. - PubMed
    1. Bahill AT, Kallman JS, Lieberman JE. Frequency limitations of the two-point central difference differentiation algorithm. Biol Cybern. 1982;45:1–4. - PubMed

Publication types

LinkOut - more resources