Aggravated renal inflammatory responses in TRPV1 gene knockout mice subjected to DOCA-salt hypertension
- PMID: 19794112
- PMCID: PMC2801340
- DOI: 10.1152/ajprenal.00012.2009
Aggravated renal inflammatory responses in TRPV1 gene knockout mice subjected to DOCA-salt hypertension
Abstract
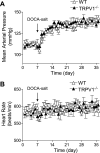
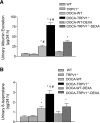
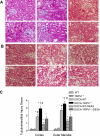
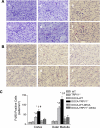
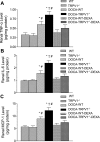
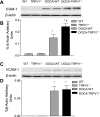
To test the hypothesis that deletion of the transient receptor potential vanilloid type 1 (TRPV1) channel exaggerates hypertension-induced renal inflammatory response, wild-type (WT) or TRPV1-null mutant (TRPV1(-/-)) mice were subjected to uninephrectomy and deoxycorticosterone acetate (DOCA)-salt treatment for 4 wk. Mean arterial pressure (MAP) determined by radiotelemetry increased in DOCA-salt-treated WT or TRPV1(-/-) mice, whereas there was no difference in MAP between two strains at the baseline or after DOCA-salt treatment. DOCA-salt treatment increased urinary excretion of albumin and 8-isoprostane in both WT and TRPV1(-/-) mice, and the increases were greater in magnitude in the latter strain. Periodic acid-Schiff and Mason's trichrome staining showed that kidneys of DOCA-salt-treated TRPV1(-/-) mice exhibited more severe glomerulosclerosis and tubulointerstitial injury compared with DOCA-salt-treated WT mice. NF-kappaB assay showed that DOCA-salt treatment increased renal activated NF-kappaB concentrations in TRPV1(-/-) mice compared with WT mice. Immunostaining and ELISA assay revealed that DOCA-salt-treated TRPV1(-/-) mice had enhanced renal infiltration of monocyte/macrophage and lymphocyte, as well as increased renal levels of proinflammatory cytokine (TNF-alpha, IL-6) and chemokine (MCP-1) compared with DOCA-salt-treated WT mice. Renal ICAM-1 but not VCAM-1 expression was also greater in DOCA-salt-treated TRPV1(-/-) than WT mice. Dexamethasone (DEXA), an immunosuppressive drug, conveyed a renoprotective effect that was greater in DOCA-salt-treated TRPV1(-/-) compared with WT mice. These data show that renal inflammation is exacerbated in DOCA-salt hypertension when TRPV1 gene is deleted and that the deterioration is ameliorated by DEXA treatment, indicating that TRPV1 may act as a potential regulator of the inflammatory process to lessen renal injury in DOCA-salt hypertension.
Figures



Similar articles
-
Role of the monocyte chemoattractant protein-1/C-C chemokine receptor 2 signaling pathway in transient receptor potential vanilloid type 1 ablation-induced renal injury in salt-sensitive hypertension.Exp Biol Med (Maywood). 2015 Sep;240(9):1223-34. doi: 10.1177/1535370214565970. Epub 2015 Jan 13. Exp Biol Med (Maywood). 2015. PMID: 25585624 Free PMC article.
-
Deletion of transient receptor potential vanilloid type 1 receptors exaggerates renal damage in deoxycorticosterone acetate-salt hypertension.Hypertension. 2008 Aug;52(2):264-70. doi: 10.1161/HYPERTENSIONAHA.108.110197. Epub 2008 Jul 7. Hypertension. 2008. PMID: 18606907 Free PMC article.
-
[Role of transient receptor potential vanilloid type 1 and C-C chemokine receptor 2 in renal injury induced by salt-sensitive hype].Zhongguo Yi Xue Ke Xue Yuan Xue Bao. 2014 Oct;36(5):488-95. doi: 10.3881/j.issn.1000-503X.2014.05.006. Zhongguo Yi Xue Ke Xue Yuan Xue Bao. 2014. PMID: 25360645 Chinese.
-
Protective effect of TRPV1 against renal fibrosis via inhibition of TGF-β/Smad signaling in DOCA-salt hypertension.Mol Med. 2011;17(11-12):1204-12. doi: 10.2119/molmed.2011.00063. Epub 2011 Jul 22. Mol Med. 2011. PMID: 21792478 Free PMC article.
-
Triptolide attenuates renal damage by limiting inflammatory responses in DOCA-salt hypertension.Int Immunopharmacol. 2020 Dec;89(Pt A):107035. doi: 10.1016/j.intimp.2020.107035. Epub 2020 Oct 9. Int Immunopharmacol. 2020. PMID: 33045566
Cited by
-
Impact of perinatal hypertonic NaCl access on adult offspring's sodium intake and angiotensin and vasopressin systems under hypertension model.Sci Rep. 2025 Mar 15;15(1):8933. doi: 10.1038/s41598-025-93238-4. Sci Rep. 2025. PMID: 40089597 Free PMC article.
-
Capsaicin mediates caspases activation and induces apoptosis through P38 and JNK MAPK pathways in human renal carcinoma.BMC Cancer. 2016 Oct 12;16(1):790. doi: 10.1186/s12885-016-2831-y. BMC Cancer. 2016. PMID: 27729033 Free PMC article.
-
Pentosan polysulfate preserves renal microvascular P2X1 receptor reactivity and autoregulatory behavior in DOCA-salt hypertensive rats.Am J Physiol Renal Physiol. 2016 Mar 15;310(6):F456-65. doi: 10.1152/ajprenal.00110.2015. Epub 2015 Dec 23. Am J Physiol Renal Physiol. 2016. PMID: 26697978 Free PMC article.
-
Inhibition of transient receptor potential vanilloid 1 (TRPV1) channel regulates chikungunya virus infection in macrophages.Arch Virol. 2021 Jan;166(1):139-155. doi: 10.1007/s00705-020-04852-8. Epub 2020 Oct 30. Arch Virol. 2021. PMID: 33125586
-
Role of the monocyte chemoattractant protein-1/C-C chemokine receptor 2 signaling pathway in transient receptor potential vanilloid type 1 ablation-induced renal injury in salt-sensitive hypertension.Exp Biol Med (Maywood). 2015 Sep;240(9):1223-34. doi: 10.1177/1535370214565970. Epub 2015 Jan 13. Exp Biol Med (Maywood). 2015. PMID: 25585624 Free PMC article.
References
-
- Albelda SM, Smith CW, Ward PA. Adhesion molecules and inflammatory injury. FASEB J 8: 504–512, 1994 - PubMed
-
- Baggiolini M, Dewald B, Moser B. Human chemokines: an update. Annu Rev Immunol 15: 675–705, 1997 - PubMed
-
- Beswick RA, Zhang H, Marable D, Catravas JD, Hill WD, Webb RC. Long-term antioxidant administration attenuates mineralocorticoid hypertension and renal inflammatory responase. Hypertension 37: 781–786, 2001 - PubMed
Publication types
MeSH terms
Substances
Grants and funding
LinkOut - more resources
Full Text Sources
Medical
Molecular Biology Databases
Miscellaneous

