. 2009 Sep;21(9):2624-41.
doi: 10.1105/tpc.109.069765. Epub 2009 Sep 30.

Cryptochromes, phytochromes, and COP1 regulate light-controlled stomatal development in Arabidopsis

Affiliations

Cryptochromes, phytochromes, and COP1 regulate light-controlled stomatal development in Arabidopsis

Chun-Ying Kang et al. Plant Cell. 2009 Sep.

Abstract

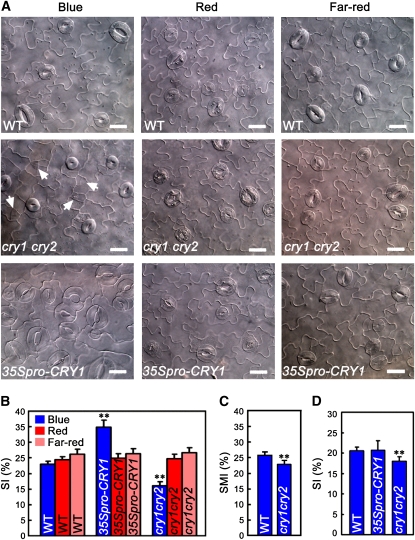
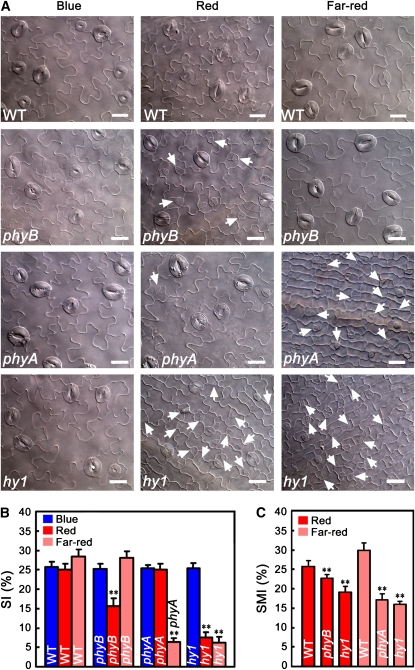
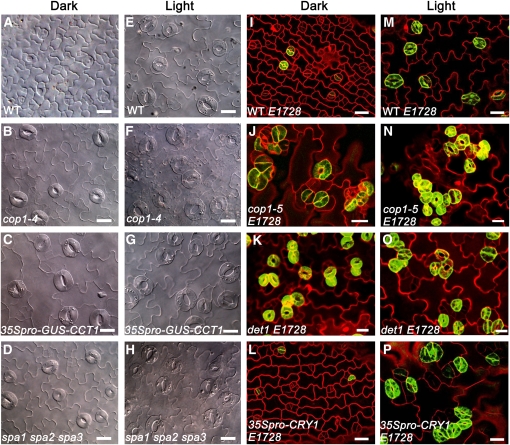
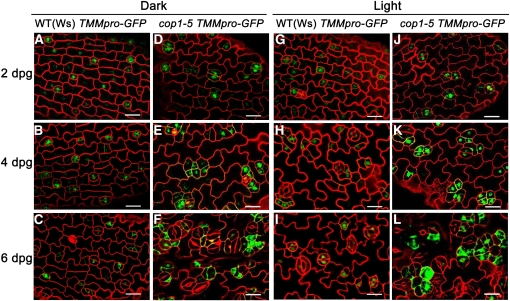
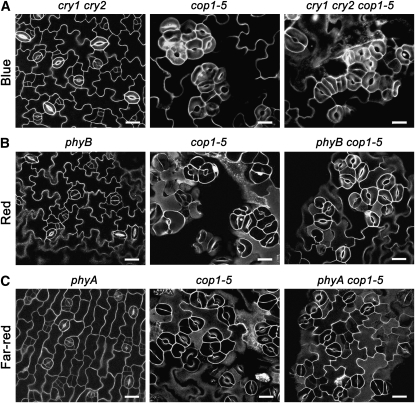
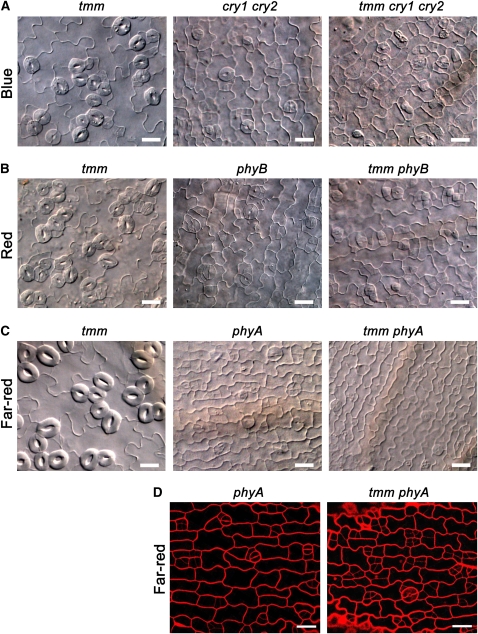
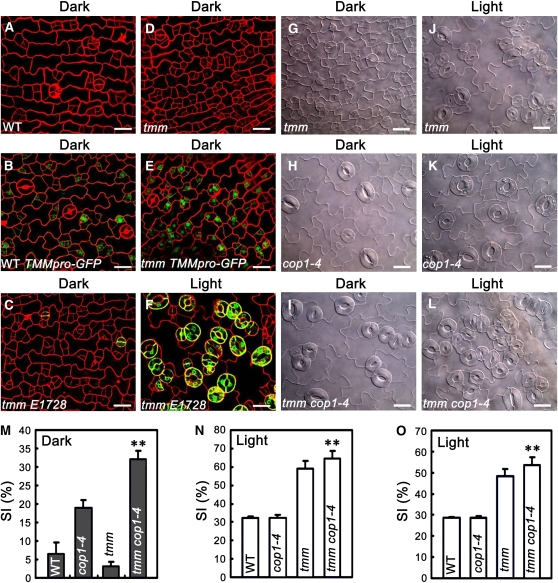
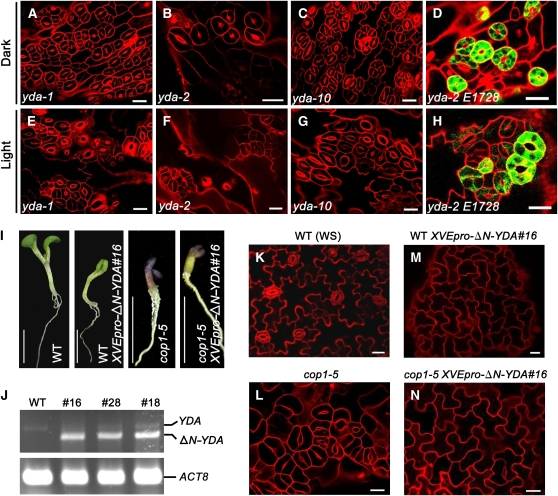
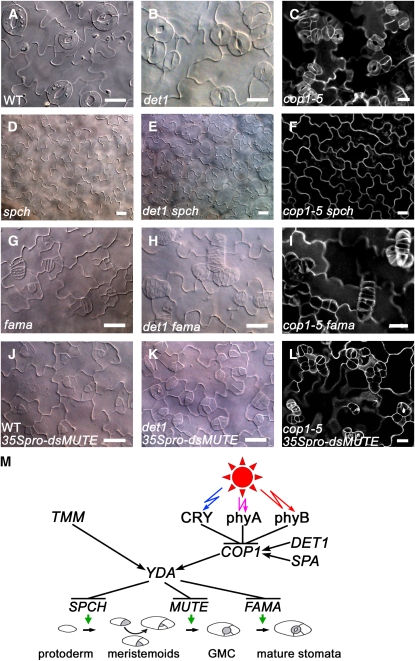
In Arabidopsis thaliana, the cryptochrome (CRY) blue light photoreceptors and the phytochrome (phy) red/far-red light photoreceptors mediate a variety of light responses. COP1, a RING motif-containing E3 ubiquitin ligase, acts as a key repressor of photomorphogenesis. Production of stomata, which mediate gas and water vapor exchange between plants and their environment, is regulated by light and involves phyB and COP1. Here, we show that, in the loss-of-function mutants of CRY and phyB, stomatal development is inhibited under blue and red light, respectively. In the loss-of-function mutant of phyA, stomata are barely developed under far-red light. Strikingly, in the loss-of-function mutant of either COP1 or YDA, a mitogen-activated protein kinase kinase kinase, mature stomata are developed constitutively and produced in clusters in both light and darkness. CRY, phyA, and phyB act additively to promote stomatal development. COP1 acts genetically downstream of CRY, phyA, and phyB and in parallel with the leucine-rich repeat receptor-like protein TOO MANY MOUTHS but upstream of YDA and the three basic helix-loop-helix proteins SPEECHLESS, MUTE, and FAMA, respectively. These findings suggest that light-controlled stomatal development is likely mediated through a crosstalk between the cryptochrome-phytochrome-COP1 signaling system and the mitogen-activated protein kinase signaling pathway.


Figures

Figure 1.
Figure 1.
Cryptochromes Are Required for Blue Light–Triggered Stomatal Development. (A) Differential interference contrast (DIC) images of the abaxial cotyledon epidermis of 10-d-old wild-type, cry1 cry2 double mutant, and 35Spro–CRY1 seedlings. Seedlings were grown in blue light (30 μmol·m−2·s−1), red light (50 μmol·m−2·s−1), and far-red light (12 μmol·m−2·s−1). Meristemoids are indicated by arrowheads. Bars = 20 μm. (B) The SI obtained from the samples in (A). In (B) to (D), the SI and SMI are presented as the percentage of mean ± sd. Asterisks denote significant differences between the indicated genotypes and the wild type (t test, P < 0.01), n = 10. (C) The SMI obtained from the samples in (A). Asterisks denote significant difference between cry1 cry2 and the wild type (t test, P < 0.01), n = 10. (D) The SI of the abaxial leaf epidermis of ∼4-week-old wild-type, 35Spro–CRY1, and cry1 cry2 plants grown under blue light (50 μmol·m−2·s−1). Asterisks denote significant differences between cry1 cry2 and the wild type (t test, P < 0.01), n = 5.
Figure 2.
Figure 2.
Phytochromes Are Required for Red and Far-Red Light–Triggered Stomatal Development. (A) DIC images of the abaxial cotyledon epidermis of 10-d-old wild-type, phyB, phyA, and hy1 seedlings grown under blue light (30 μmol·m−2·s−1), red light (50 μmol·m−2·s−1), and far-red light (12 μmol·m−2·s−1). Meristemoids are indicated by arrowheads. Bars = 20 μm. (B) The SI obtained from the samples in (A). In (B) and (C), the SI and SMI are presented as the percentage of mean ± sd. Asterisks denote significant differences between the indicated genotypes and the wild type (t test, P < 0.01), n = 10. (C) The SMI obtained from the samples in (A). Asterisks denote significant differences between the indicated genotypes and the wild type (t test, P < 0.01), n = 10.
Figure 3.
Figure 3.
COP1 Acts Constitutively to Suppress Stomatal Development and Differentiation and Is Regulated by CRY1, SPA, and DET1. (A) to (D) DIC images of the abaxial cotyledon epidermis of 10-d-old dark-grown wild-type (A), cop1-4 (B), 35Spro–GUSCCT1 (C), and spa1 spa2 spa3 (D) seedlings. (E) to (H) DIC images of the abaxial cotyledon epidermis of wild-type (E), cop1-4 (F), 35Spro–GUSCCT1 (G), and spa1 spa2 spa3 (H) seedlings grown under white light (150 μmol·m−2·s−1) for 10 d. (I) to (L) Confocal images of the abaxial cotyledon epidermis of 7-d-old dark-grown wild-type expressing E1728 (WT E1728) (I), cop1-5 mutant expressing E1728 (cop1-5 E1728) (J), det1 mutant expressing E1728 (det1 E1728) (K), and 35Spro–CRY1 expressing E1728 (35Spro–CRY1 E1728) (L). (M) to (P) Confocal images of the abaxial cotyledon epidermis of 7-d-old light-grown WT E1728 (M), cop1-5 E1728 (N), det1 E1728 (O), and 35Spro–CRY1 E1728 (P). Light condition for (M) to (O) is white light (150 μmol·m−2·s−1), and for (P) is blue light (50 μmol·m−2·s−1). In (I) to (P), epidermal cell periphery is highlighted by propidium iodide (PI; red), and mature guard cells are indicated by the E1728 marker (green). Bars = 20 μm.
Figure 4.
Figure 4.
Time Sequence of Stomatal Differentiation in the cop1-5 Mutant. Confocal images of the abaxial epidermis of wild-type and cop1-5 cotyledons. TMMpro–GFP (green) was used to monitor stomatal lineage cells. Red, PI counterstaining. Bars = 20 μm. (A) to (C) Wild-type epidermis at 2, 4, and 6 dpg in the dark, respectively. (D) to (F) cop1-5 epidermis at 2, 4, and 6 dpg in the dark, respectively. (G) to (I) Wild-type epidermis at 2, 4, and 6 dpg in white light (150 μmol·m−2·s−1), respectively. (J) to (L) cop1-5 epidermis at 2, 4, and 6 dpg in white light (150 μmol·m−2·s−1), respectively.
Figure 5.
Figure 5.
COP1 Genetically Acts Downstream of CRY1, CRY2, phyA, and phyB. (A) Confocal images of the cotyledon epidermis of cry1 cry2, cop1-5, and cry1 cry2 cop1-5 seedlings grown under blue light (30 μmol·m−2·s−1) for 10 d. (B) Confocal images of the cotyledon epidermis of phyB, cop1-5, and phyB cop1-5 seedlings grown under red light (50 μmol·m−2·s−1) for 10 d. (C) Confocal images of the cotyledon epidermis of phyA, cop1-5, and phyA cop1-5 seedlings grown under far-red light (12 μmol·m−2·s−1) for 10 d. Cell shapes were visualized by staining by PI. Bars = 20 μm.
Figure 6.
Figure 6.
Mutations in Cryptochromes or Phytochromes Attenuate the Stomatal Cluster Phenotype of the tmm Mutant. (A) DIC images of the cotyledon epidermis of tmm, cry1 cry2, and tmm cry1 cry2 seedlings grown in blue light (10 μmol·m−2·s−1) for 10 d. (B) DIC images of the cotyledon epidermis of tmm, phyB, and tmm phyB seedlings grown in red light (10 μmol·m−2·s−1) for 10 d. (C) DIC images of the cotyledon epidermis of tmm, phyA, and tmm phyA seedlings grown in far-red light (12 μmol·m−2·s−1) for 10 d. (D) Confocal images of the cotyledon epidermis of phyA and tmm phyA prepared from (C). PI is presented in red. Bars = 20 μm.
Figure 7.
Figure 7.
TMM and COP1 Act Additively to Regulate Stomatal Patterning. (A) to (E) Confocal images of the cotyledon epidermis of 6-d-old dark-grown wild-type (A), WT TMMpro–GFP (B), tmm E1728 (C), tmm (D), and tmm TMMpro–GFP (E) seedlings. (F) Confocal images of the cotyledon epidermis of tmm E1728 seedlings grown in white light (150 μmol·m−2·s−1) for 6 d. Red, PI counterstaining; green, GFP fluorescence. (G) to (I) DIC images of the cotyledon epidermis of 10-d-old dark-grown tmm (G), cop1-4 (H) and tmm cop1-4 (I) seedlings. (J) to (L) DIC images of the cotyledon epidermis of tmm (J), cop1-4 (K), and tmm cop1-4 (L) seedlings grown in blue (30 μmol·m−2·s−1) plus red (50 μmol·m−2·s−1) plus far-red light (6 μmol·m−2·s−1) for 10 d. Bars = 20 μm. (M) The SI obtained from (G) to (I). Asterisks denote a significant difference between tmm cop1-4 and cop1-4 mutants (t test, P < 0.01), n = 10. (N) The SI obtained from (J) to (L). Asterisks denote a significant difference between tmm cop1-4 and tmm mutants (t test, P < 0.01), n = 10. (O) The SI of the abaxial true leaf epidermis of the various genotypes of adult plants grown in the same light condition as in (J) to (L) for ∼4 weeks. Asterisks denote a significant difference between tmm cop1-4 and tmm mutants (t test, P < 0.01), n = 5.
Figure 8.
Figure 8.
YDA Genetically Acts Downstream of COP1. (A) to (D) Confocal images of the cotyledon epidermis of 7-d-old dark-grown yda-1 (A), yda-2 (B), yda-10 (C), and yda-2 E1728 (D) seedlings. (E) to (H) Confocal images of the cotyledon epidermis of yda-1 (E), yda-2 (F), yda-10 (G), and yda-2 E1728 (H) seedlings grown in white light (150 μmol·m−2·s−1) for 7 d. Bars = 20 μm. (I) Transgenic XVEpro–ΔN–YDA#16 seedlings at 7 dpg under white light (150 μmol·m−2·s−1). Seedlings are in the wild-type or in the cop1-5 mutant background as indicated. Bars = 0.5 cm. (J) RT-PCR analysis of leaky expression of ΔN–YDA in three independent transgenic lines XVEpro–ΔN–YDA#16, #28, and #18. YDA denotes endogenous YDA expression. ACT8 was used as a loading control. (K) to (N) Confocal images of the cotyledon epidermis of wild-type (K), cop1-5 (L), WT XVEpro–ΔN–YDA#16 (M), and cop1-5 XVEpro–ΔN–YDA#16 (N) seedlings prepared from (I). Red, PI counterstaining; green, GFP fluorescence. Bars = 20 μm.
Figure 9.
Figure 9.
Genetic Interactions of COP1 and DET1 with SPCH, MUTE, and FAMA. (A) to (L) Abaxial cotyledon epidermis of 10-d-old white-light (150 μmol·m−2·s−1)-grown wild type (A), det1 (B), cop1-5 (C), spch (D), det1 spch (E), cop1-5 spch (F), fama (G), det1 fama (H), cop1-5 fama (I), WT 35Spro–dsMUTE (J), det1 35Spro–dsMUTE (K), and cop1-5 35Spro–dsMUTE (L). The images in (C), (F), (I), and (L) are PI (white)-outlined photomicrographs, and the others are DIC photomicrographs. Bars = 20 μm. (M) A genetic model for the light signaling pathway and its interaction with the developmental pathway. COP1 activity is negatively regulated by CRY, phyA, and phyB but is positively regulated by SPA and DET1, presumably through physical interactions (Wang et al., 2001; Yang et al., 2001; Seo et al., 2003; Yanagawa et al., 2004). YDA might be positively regulated by COP1 through yet unknown mechanisms. Arrow, positive regulation; T-bar, negative regulation. GMC, guard mother cell.

Comment in

Similar articles

Cited by

References

    1. Al-Sady, B., Ni, W., Kircher, S., Schäfer, E., and Quail, P.H. (2006). Photoactivated phytochrome induces rapid PIF3 phosphorylation prior to proteasome-mediated degradation. Mol. Cell 23 439–446. - PubMed
    1. Ang, L.H., and Deng, X.W. (1994). Regulatory hierarchy of photomorphogenic loci: Allele-specific and light-dependent interaction between the HY5 and COP1 loci. Plant Cell 6 613–628. - PMC - PubMed
    1. Assmann, S.M., and Wang, X.Q. (2001). From milliseconds to millions of years: Guard cells and environmental responses. Curr. Opin. Plant Biol. 4 421–428. - PubMed
    1. Benvenuto, G., Formiggini, F., Laflamme, P., Malakhov, M., and Bowler, C. (2002). The photomorphogenesis regulator DET1 binds the amino-terminal tail of histone H2B in a nucleosome context. Curr. Biol. 12 1529–1534. - PubMed
    1. Berger, D., and Altmann, T. (2000). A subtilisin-like serine protease involved in the regulation of stomatal density and distribution in Arabidopsis thaliana. Genes Dev. 14 1119–1131. - PMC - PubMed

Publication types

MeSH terms