. 2009 Dec 10;114(25):5152-61.
doi: 10.1182/blood-2009-04-214569.

In vivo delivery of a microRNA-regulated transgene induces antigen-specific regulatory T cells and promotes immunologic tolerance

Affiliations

In vivo delivery of a microRNA-regulated transgene induces antigen-specific regulatory T cells and promotes immunologic tolerance

Andrea Annoni et al. Blood. .

Abstract

We previously showed that incorporating target sequences for the hematopoietic-specific microRNA miR-142 into an antigen-encoding transgene prevents antigen expression in antigen-presenting cells (APCs). To determine whether this approach induces immunologic tolerance, we treated mice with a miR-142-regulated lentiviral vector encoding green fluorescent protein (GFP), and subsequently vaccinated the mice against GFP. In contrast to control mice, no anti-GFP response was observed, indicating that robust tolerance to the transgene-encoded antigen was achieved. Furthermore, injection of the miR-142-regulated vector induced a population of GFP-specific regulatory T cells. Interestingly, an anti-GFP response was observed when microRNA miR-122a was inserted into the vector and antigen expression was detargeted from hepatocytes as well as APCs. This demonstrates that, in the context of lentiviral vector-mediated gene transfer, detargeting antigen expression from professional APCs, coupled with expression in hepatocytes, can induce antigen-specific immunologic tolerance.


Figures

Figure 1
Figure 1
Monitoring the transgene-specific immune response in mice injected with PGK.142T. BALB/c mice were intravenously injected with LV PGK or PGK.142T encoding GFP. (A) Confocal fluorescent microscopy analysis showing GFP (green) expression patterns in the liver at the indicated times. Scale bar = 100 μm. (B) The frequency of IFN-γ–producing, GFP-specific CD8+ T cells in the spleen of treated mice was determined by ELISPOT at the indicated times. Data are expressed as the mean ± SD number of GFP-specific CD8+ T cells per 106 total CD8+ T cells. Measurement of the GFP+ cell-specific killing capacity of CTL derived from treated mice was performed by chromium release assay using different ratios of CD8+ effector T cells: P815 target cell line (P815 cell line, BALB/c syngeneic mastocytoma-derived cell line, was in vitro transduced to stably express GFP, or untransduced as control). (C) Measurement of the GFP-driven killing capacity of liver-derived CD8+ T cell; 10:1 ratio is reported. (D) Measurement of the GFP+ cell-specific killing capacity of spleen CD8+ T cell. The 100:1 ratio of effector:target cells is shown. Data are expressed as the mean ± SD percentage of target cell lysis. (E-F) The frequency of GFP-specific CD8+ T cells in the liver (E) and spleen (F) was determined by FACS analysis of intrahepatic leukocytes and splenocytes, respectively, stained with a pentamer loaded with the H-2Kd immunodominant epitope of GFP, GFP200-208. Analysis was performed 6 weeks postinjection (n = 3/group). A representative dot plot is shown. Below, the mean ± SD of the experiment is provided. (G) Quantification of the absolute number of CD8+ T cells infiltrating the liver 6 weeks after LV injection. Shown as the mean ± SD (n = 3/group).
Figure 2
Figure 2
Vaccine challenge of PGK.142T-treated mice. PGK- and PGK.142T-treated BALB/c mice were vaccinated at 6 weeks after vector injection by administration of a plasmid encoding GFP into cardiotoxin-injured muscle. Analysis was performed 12 days after vaccination. (A-B) The frequency of IFN-γ–producing GFP-specific CD8+ T cells in the spleen and liver of treated mice was determined by ELISPOT. Data are expressed as the mean ± SD number of GFP-specific CD8+ T cells per 106 total CD8+ T cells. Note that vaccination was able to induce a primary immune response to GFP in PBS-treated mice, and a secondary immune response to GFP in PGK-treated mice, but not in PGK.142T-treated mice. (C) Liver sections were analyzed by confocal microscopy after staining for GFP and nuclei. Scale bar = 100 μm. Images are representative of 2 separate experiments (n = 6 mice/group). Also shown is the mean C/G from the livers of treated mice (n = 6).
Figure 3
Figure 3
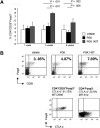
Measurement of CD4+CD25+Foxp3+ Tregs in the liver of PGK and PGK.142T vector-treated mice. Mice were injected with vehicle, PGK, or PGK.142T. (A) At the indicated times, mice were killed and the frequency of CD4+CD25+Foxp3+ Tregs in the liver was determined by FACS analysis. Data are expressed as the mean ± SD. A representative 3 experiments is shown, n = 3/group (n = 9/vector), except for vehicle injected (n = 17). (B) Representative dot plot gated on CD4+ cells is presented for each group at 3 weeks postinjection. The percentage of CD4+CD25+Foxp3+ Tregs is reported in the top right quadrant. CTLA-4 expression is shown gating on CD4+CD25+Foxp3+ Tregs or CD4+Foxp3 T cells.
Figure 4
Figure 4
Examination of the role and function of CD4+CD25+Foxp3+ Tregs in PGK.142T-mediated gene transfer. Mice were injected with the PC61 mAb (anti–mouse CD25, 1 mg/mouse) 5 days before treatment with PGK.142T. (A) At the time of vector injection, the number of Tregs was determined by FACS analysis of splenocytes immunostained for CD4, CD25 (clone 7D4), and Foxp3. (B) At 6 weeks after vector injection, mice were killed and GFP expression in the liver was monitored by confocal microscopy. GFP was visualized by anti-GFP staining (green), and nuclei by Topro-3 staining (blue). Also shown is the mean ± SD C/G from the livers of treated mice (n = 9). (C-D) The frequency of IFN-γ–producing, GFP-specific CD8+ T cells in the spleen (C) and liver (D) of treated mice was determined by ELISPOT assay. Data are expressed as the mean ± SD number of GFP-specific CD8+ T cells per 106 total CD8+ T cells. For the spleen, analysis was performed on isolated CD8+ T cells, whereas for the liver, analysis was performed on total intrahepatic leukocytes, and the amount of CD8+ T cells was determined by FACS analysis (data not shown). The frequency of GFP-specific CD8+ T cells in the spleen (C) and liver (D) was determined by FACS analysis of splenocytes and intrahepatic leukocytes, respectively, stained with a H-2Kd pentamer loaded with the immunodominant epitope of GFP, HYLSTQSAL (GFP200-208). A representative dot plot is shown from 1 of 3 separate experiments (n = 3/group per experiment; n = 9/vector). (E) Transaminase levels (ALT U/L) were determined in the sera of treated mice at the time of sacrifice; data are expressed as mean ± SD (n = 6/group). Normal ALT levels, detected in the sera of vehicle-injected mice, are 60 ± 40 U/L (n = 3, gray area).
Figure 5
Figure 5
Evaluation of antigen specificity of CD4+CD25+Foxp3+ Tregs in the liver of PGK.142T-treated mice. (A) CD4+ T cells were isolated from the livers of mice treated 3 weeks prior with PGK.142T. Cell purity was determined by FACS analysis (> 90%). Purified hepatic CD4+ T cells from PGK.142T-treated mice were injected into naive recipient mice (106 CD4+ T cells/mouse). Two days later, the mice received DNA vaccination to induce a cellular immune response to GFP or to hepatitis B small env subunit (HBs), an unrelated antigen. Twelve days after DNA vaccination, in vivo CTL assay was performed. Mice were infused with splenocytes labeled with different concentrations of CFSE and pulsed with either HBs28-39 (CFSEint) or GFP200-208 (CFSEhi), or left unpulsed (CFSElow). Draining lymph nodes were collected, and FACS analysis was performed to quantitate the surviving cells. Mice receiving vaccination alone are show as filled histograms (n = 5), and mice receiving vaccination plus adoptive transfer of hepatic CD4+ T cells are shown as open histograms (n = 3). A representative histogram for each experimental group is shown (no vaccination, top panel; GFP vaccinated, midpanel; HBs vaccinated, bottom panel). The mean percentage ± SD of antigen-driven target cell lysis values for each experimental group of mice is reported (A right panel). (B) Liver-infiltrating CD4+ T cells isolated from mice treated with PGK or tolerized to GFP by PGK.142T vector were sorted by CD25 expression, and the 4 resulting populations were adoptively transferred (0.8 × 10⁵ cell/mouse) into naive mice that underwent GFP vaccination 2 days later. As described above, in vivo CTL assay was performed 12 days after vaccination. Mice receiving vaccination alone are shown as filled histograms (n = 10), and mice receiving vaccination plus adoptive transfer of hepatic CD4+CD25 (n = 8) and CD4+CD25+ (n = 8) T cells derived either from PGK- or PGK.142T-treated mice are shown as open histograms. A representative histogram for each experimental group is shown. The mean percentage of antigen-driven target cell lysis ± SD values for each experimental group of mice is reported (B, right panel).
Figure 6
Figure 6
Determination of the contribution of LSECs and hepatocytes to the stability of gene transfer. Mice were injected with either the hepatocyte-specific vector, ET.142T, or a LV-containing target sequence for miR-122 and miR-142, PGK.142T.122T. (A) Confocal fluorescent microscopy was performed on liver section to analyze the pattern of GFP expression (green). Sections were stained with anti-CD31 (red) to detect liver sinusoidal endothelial cells. Note that the majority of GFP-positive cells are also positive for CD31 (yellow), indicating that PGK.142T.122T expression is confined to endothelial cells. (B) Confocal fluorescent microscopy of the liver at 1 and 6 weeks after vector injection. GFP was visualized by anti-GFP staining, and nuclei by Topro-3 staining (blue). Scale bar = 100 μm. A representative image of 2 experiments (n = 3/group per experiment) is shown. (C-D) Leukocytes infiltrating the liver were isolated (C) 1 and (D) 6 weeks after vector administration, and the frequency of GFP-specific CD8+ T cells was evaluated by H-2Kd-GFP200-208 pentamer staining. Data are expressed as the mean ± SD percentage of GFP200-208-H2-Kd+CD8+ T cells. To the right, a representative dot plot, gated on CD8+ cells, is shown from 1 of 2 experiments (n = 3/group per experiment). (E) The frequency of CD4+CD25+Foxp3+ Tregs was quantified by FACS analysis. Data are expressed as mean ± SD percentage of positive cells. To the right, a representative dot plot, gated on CD4+ T cells, is shown from 1 of 2 experiments (n = 3/group per experiment).

References

    1. Miller SD, Turley DM, Podojil JR. Antigen-specific tolerance strategies for the prevention and treatment of autoimmune disease. Nat Rev Immunol. 2007;7:665–677. - PubMed
    1. Waldmann H, Adams E, Fairchild P, Cobbold S. Infectious tolerance and the long-term acceptance of transplanted tissue. Immunol Rev. 2006;212:301–313. - PubMed
    1. Tang Q, Bluestone JA. Regulatory T-cell physiology and application to treat autoimmunity. Immunol Rev. 2006;212:217–237. - PubMed
    1. Tang Q, Adams JY, Tooley AJ, et al. Visualizing regulatory T cell control of autoimmune responses in nonobese diabetic mice. Nat Immunol. 2006;7:83–92. - PMC - PubMed
    1. Vignali DA, Collison LW, Workman CJ. How regulatory T cells work. Nat Rev Immunol. 2008;8:523–532. - PMC - PubMed

Publication types

MeSH terms