. 2009 Dec;297(6):C1434-44.
doi: 10.1152/ajpcell.00248.2009. Epub 2009 Sep 30.

mTOR regulates skeletal muscle regeneration in vivo through kinase-dependent and kinase-independent mechanisms

Affiliations

mTOR regulates skeletal muscle regeneration in vivo through kinase-dependent and kinase-independent mechanisms

Yejing Ge et al. Am J Physiol Cell Physiol. 2009 Dec.

Abstract

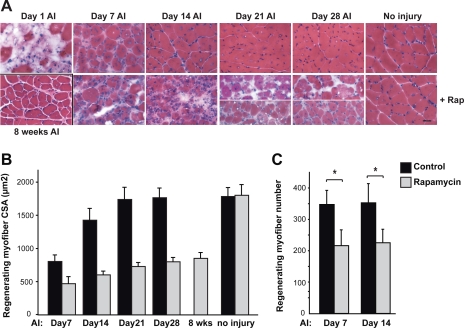
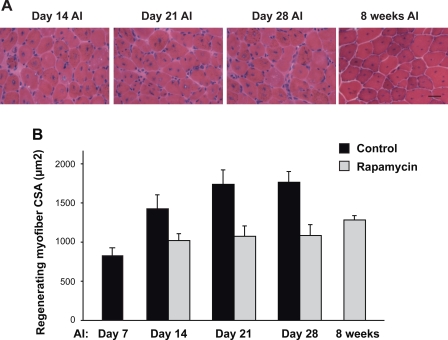
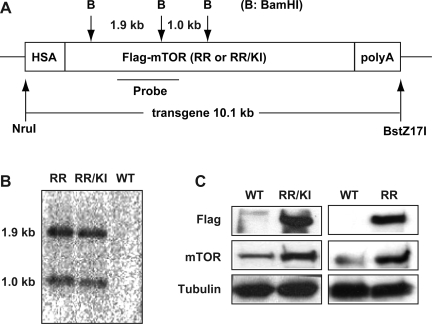
Rapamycin-sensitive signaling is required for skeletal muscle differentiation and remodeling. In cultured myoblasts, the mammalian target of rapamycin (mTOR) has been reported to regulate differentiation at different stages through distinct mechanisms, including one that is independent of mTOR kinase activity. However, the kinase-independent function of mTOR remains controversial, and no in vivo studies have examined those mTOR myogenic mechanisms previously identified in vitro. In this study, we find that rapamycin impairs injury-induced muscle regeneration. To validate the role of mTOR with genetic evidence and to probe the mechanism of mTOR function, we have generated and characterized transgenic mice expressing two mutants of mTOR under the control of human skeletal actin (HSA) promoter: rapamycin-resistant (RR) and RR/kinase-inactive (RR/KI). Our results show that muscle regeneration in rapamycin-administered mice is restored by RR-mTOR expression. In the RR/KI-mTOR mice, nascent myofiber formation during the early phase of regeneration proceeds in the presence of rapamycin, but growth of the regenerating myofibers is blocked by rapamycin. Igf2 mRNA levels increase drastically during early regeneration, which is sensitive to rapamycin in wild-type muscles but partially resistant to rapamycin in both RR- and RR/KI-mTOR muscles, consistent with mTOR regulation of Igf2 expression in a kinase-independent manner. Furthermore, systemic ablation of S6K1, a target of mTOR kinase, results in impaired muscle growth but normal nascent myofiber formation during regeneration. Therefore, mTOR regulates muscle regeneration through kinase-independent and kinase-dependent mechanisms at the stages of nascent myofiber formation and myofiber growth, respectively.


Figures

Fig. 1.
Fig. 1.
Muscle regeneration is impaired by rapamycin (Rap). Injury of the hindlimb tibialis anterior (TA) muscle was induced by BaCl2 injection in 10-wk-old male mice. The “no injury” control muscles received saline injection. Where indicated, Rap (1 mg/kg) was administered daily via intraperitoneal injection starting on day 1 after injury (AI). Vehicle was injected in all mice not receiving Rap. On various days AI, the animals were euthanized and TA muscles were isolated and cryosectioned. A: TA muscle cross-sections were stained with hematoxylin and eosin (H&E). Scale bar represents 50 μm. Two representative images are shown for day 21 and day 28 to demonstrate the abnormal muscle structure as well as smaller regenerating myofibers. B: cross-sectional area (CSAs) of regenerating myofibers, identified by their central nuclei on H&E-stained sections, were quantified. At least 100 regenerating myofibers were measured for each muscle section. C: number of regenerating myofibers was counted in an area of 614,400 μm2 for each sample. For all the data, the average results (n = 7 mice for each data point) are shown, with error bars representing SD. Paired two-tailed t-tests were performed to compare data from control and rapamycin-treated samples at each time point in C. *P < 0.01.
Fig. 2.
Fig. 2.
Rapamycin suppresses regenerating myofiber growth. Mouse TA muscles were injured by BaCl2 injection, followed by daily intraperitoneal injection of Rap (1 mg/kg) starting on day 7 AI. On the days indicated, the animals were euthanized and TA muscles were isolated and cryosectioned. A: TA muscle cross-sections were stained with H&E. Scale bar represents 50 μm. B: CSAs of regenerating myofibers were quantified. At least 100 regenerating myofibers were measured for each muscle section. The average results (n = 7 mice for each data point) are shown, with error bars representing SD. The control data (solid bars) are from Fig. 1B.
Fig. 3.
Fig. 3.
Generation of transgenic mice expressing mammalian target of Rap (mTOR) mutants. A: diagram of the mTOR transgene expression vector is shown. FLAG-tagged mTOR [Rap resistant (RR) or RR/kinase inactive (KI)] was under the control of the human skeletal muscle actin (HSA) promoter. The NruI-BstZ17I fragment was used for pronuclear injection. BamHI sites and the probe used for Southern analysis of the transgene integration are shown. B: representative Southern blot for genomic DNA isolated from RR and RR/KI mice tails is shown. C: transgene expression was examined by Western analysis of limb muscle homogenates, using anti-FLAG and anti-mTOR antibodies. Anti-tubulin blot served as a loading control.
Fig. 4.
Fig. 4.
Characterization of mTOR transgenic mice. A: TA muscles from 10-wk-old wild-type (WT), RR, and RR/KI mice were isolated, cryosectioned, and stained with H&E. The average CSAs with SD are shown below the images (n = 4–8 mice). Scale bar represents 50 μm. B: limb muscle homogenates were isolated from mice injected with Rap (1 mg/kg) or vehicle and subjected to Western analysis for phospho-S6, a read-out for mTORC1 signaling activity. Anti-tubulin blot served as a loading control.
Fig. 5.
Fig. 5.
RR-mTOR supports RR muscle regeneration. RR-mTOR mice were subjected to TA muscle injury, Rap injection, and muscle isolation as described in Fig. 1. A: TA muscle cross-sections generated on various days AI were stained with H&E. Scale bar represents 50 μm. B: number of regenerating myofibers was counted within an area of 614,400 μm2 for each sample. C: CSAs of regenerating myofibers were quantified. At least 100 regenerating myofibers were measured for each muscle section. For all the quantification data, the average results (n = 7 mice for each data point) are shown with error bars representing SD. The WT data are from Fig. 1, B and C. In B, paired two-tailed t-tests were performed to compare RR to WT samples under the same conditions (same day and same treatment), *P < 0.05. In C, two-way repeated measures ANOVA was performed to analyze regeneration in the presence of rapamycin over the time course, and between WT and RR genotypes. Overall analysis: time, P < 0.0001; genotype, P < 0.0001; interaction, P < 0.0001. Significant difference between WT and RR at each time point: **P < 0.001.
Fig. 6.
Fig. 6.
Defective muscle regeneration in RR/KI-mTOR transgenic mice in the presence of Rap. RR/KI-mTOR mice were subjected to TA muscle injury, rapamycin injection, and muscle isolation as described in Fig. 1. A: TA muscle cross-sections generated on various days AI were stained with H&E. Scale bar represents 50 μm. B: number of regenerating myofibers was counted within an area of 614,400 μm2 for each sample. The average results (n = 7 mice for each data point) are shown with error bars representing SD. Paired two-tailed t-tests were performed to compare RR/KI with WT samples under the same conditions (same day and same treatment). **P < 0.001. C: WT, RR-, and RR/KI-mTOR mice were subjected to muscle injury, Rap injection, and muscle isolation as indicated. Total RNA was extracted, and Igf2 mRNA was measured by qRT-PCR. Relative levels compared with those of day 1 AI are shown with error bars representing SD (n = 3).
Fig. 7.
Fig. 7.
Kinase activity of mTOR is dispensable for nascent myofiber formation but required for myofiber growth in muscle regeneration. A: WT and RR/KI mice were subjected to TA muscle injury and Rap injection starting on day 1 AI, followed by muscle isolation and cryosection on days 7, 14, 21, 28 AI. B: WT, RR, and RR/KI mice were subjected to TA muscle injury and Rap injection starting on day 7 AI, followed by muscle isolation and cryosection on days 14, 21, 28 AI. CSAs of regenerating myofibers were quantified. At least 100 regenerating myofibers were measured for each muscle section. The average results (n = 7 mice for each data point) are shown, with error bars representing SD. The WT data are from Figs. 1B and 2B. In B, two-way repeated measures ANOVA was performed to analyze regeneration in the presence of Rap over the time course and between different genotypes. Overall analysis: time, P < 0.0001; genotype, P < 0.0001; interaction, P = 0.001. Significant difference between WT and transgenics at each time point: **P < 0.001.
Fig. 8.
Fig. 8.
S6K1 is dispensable for nascent myofiber formation but required for myofiber growth in muscle regeneration. WT, s6k1+/−, and s6k1−/− mice were subjected to TA muscle injury, muscle isolation, and H&E staining as described in Fig. 1. A: number of regenerating myofibers was counted within an area of 614,400 μm2 for each sample. No statistically significant difference was found when comparing muscles of three genotypes at each time point. B: CSAs of regenerating myofibers were quantified. At least 100 regenerating myofibers were measured for each muscle section. The average results (n = 4 mice for each data point) are shown, with error bars representing SD. Two-way repeated measures ANOVA was performed to analyze CSA data over regeneration time and between different genotypes. Overall analysis: time, P < 0.0001; genotype, P < 0.0001; interaction, P = 0.26. Significant difference between genotypes at each time point: *P < 0.05, **P < 0.001. Significant difference between Day 28 AI and uninjured: †P < 0.05.

References

    1. Abraham RT, Wiederrecht GJ. Immunopharmacology of rapamycin. Annu Rev Immunol 14: 483– 510, 1996 - PubMed
    1. Bentzinger CF, Romanino K, Cloetta D, Lin S, Mascarenhas JB, Oliveri F, Xia J, Casanova E, Costa CF, Brink M, Zorzato F, Hall MN, Ruegg MA. Skeletal muscle-specific ablation of raptor, but not of rictor, causes metabolic changes and results in muscle dystrophy. Cell Metab 8: 411– 424, 2008 - PubMed
    1. Bodine SC, Stitt TN, Gonzalez M, Kline WO, Stover GL, Bauerlein R, Zlotchenko E, Scrimgeour A, Lawrence JC, Glass DJ, Yancopoulos GD. Akt/mTOR pathway is a crucial regulator of skeletal muscle hypertrophy and can prevent muscle atrophy in vivo. Nat Cell Biol 3: 1014– 1019, 2001 - PubMed
    1. Caldwell CJ, Mattey DL, Weller RO. Role of the basement membrane in the regeneration of skeletal muscle. Neuropathol Appl Neurobiol 16: 225– 238, 1990 - PubMed
    1. Casar JC, McKechnie BA, Fallon JR, Young MF, Brandan E. Transient up-regulation of biglycan during skeletal muscle regeneration: delayed fiber growth along with decorin increase in biglycan-deficient mice. Dev Biol 268: 358– 371, 2004 - PubMed

Publication types

MeSH terms