. 2010 Jan;35(2):445-63.
doi: 10.1038/npp.2009.149.

Fos after single and repeated self-administration of cocaine and saline in the rat: emphasis on the Basal forebrain and recalibration of expression

Affiliations

Fos after single and repeated self-administration of cocaine and saline in the rat: emphasis on the Basal forebrain and recalibration of expression

Daniel S Zahm et al. Neuropsychopharmacology. 2010 Jan.

Abstract

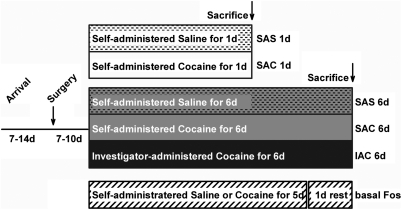
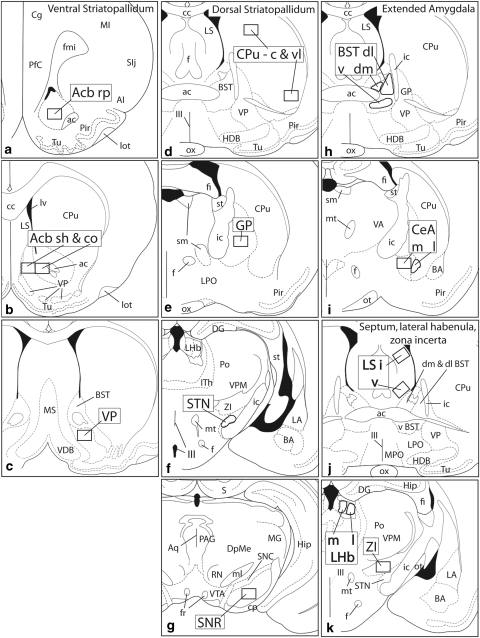
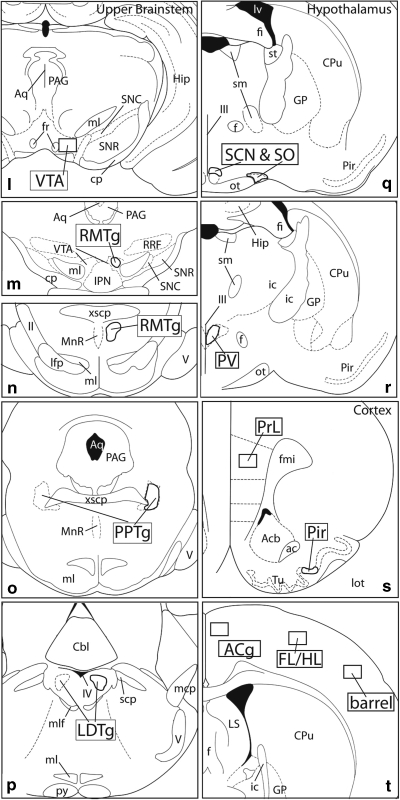
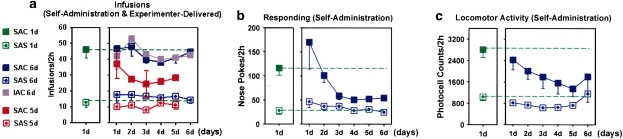
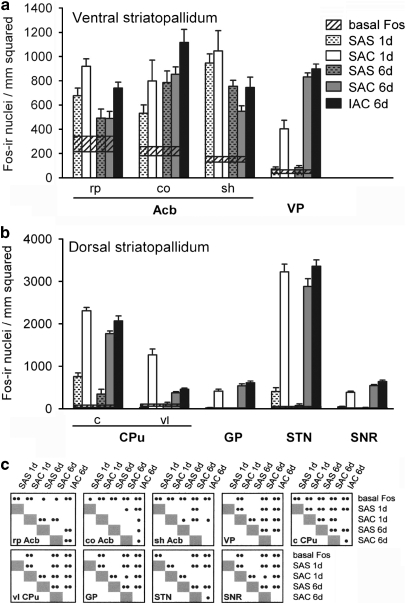
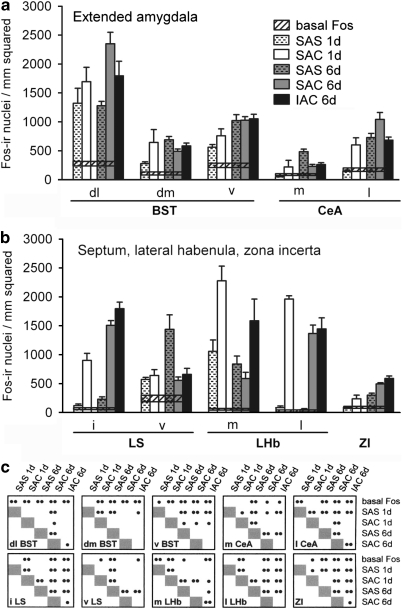
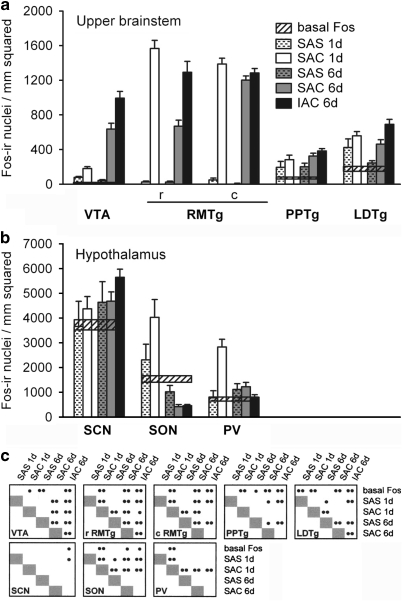
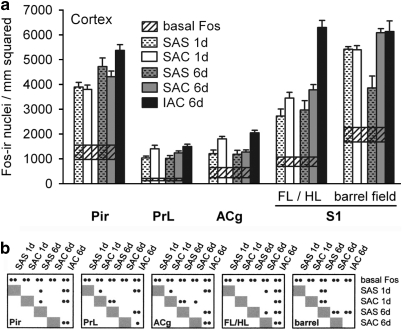
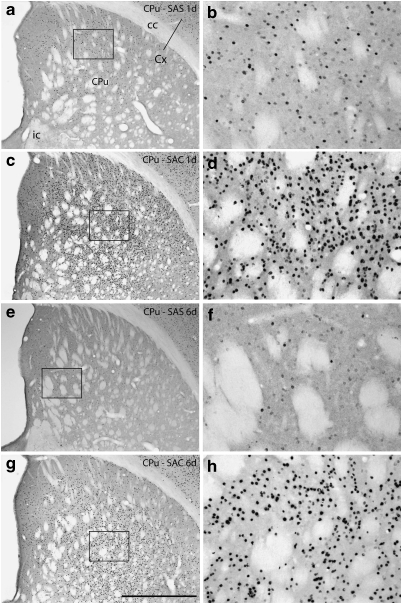
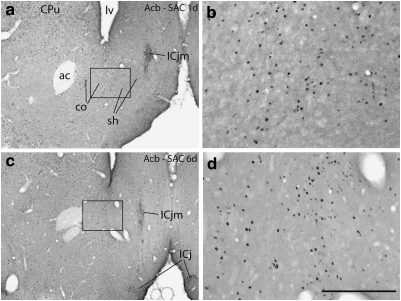
The effects of addictive psychostimulant drugs on the brain change over repeated administrations. We evaluated a large sample of brain structures, particularly ones comprising basal forebrain macrosystems, and determined in which the immediate-early gene product, Fos, is expressed following a single and repeated self-administrations of cocaine. The caudate-putamen and accumbens, comprising the basal ganglia input structures, and the hypothalamic supraoptic and paraventricular nuclei, lateral and medial habenula, mesopontine rostromedial tegmental nucleus and anterior cingulate cortex exhibited Fos expression enhanced by acute self-administration of cocaine (SAC), but desensitized after repeated administrations. Fos expression was mainly enhanced by acutely self-administered cocaine in basal ganglia output and intrinsic structures and the intermediate nucleus of lateral septum, medial division of the central amygdaloid nucleus and zona incerta, but, in contrast, was sensitized in these structures after repeated administrations. Acute and repeated SAC left Fos expression unaffected or marginally enhanced in most extended amygdala structures, of which nearly all, however, exhibited robustly increased Fos expression after repeated saline self-administration, occasionally to levels exceeding those elicited by cocaine. Thus, self-administered cocaine mainly elicits Fos expression, which persists or increases with repeated administrations in some structures, but declines in others. In addition, Fos expression is sensitized in most extended amygdala structures merely by the act of repeated self-administering. Similar spatiotemporal patterns of cocaine- or saline-elicited Fos expression characterize functionally related clusters of structures, such as, eg, basal ganglia input structures, basal ganglia output structures, extended amygdala and structures in the brainstem to which forebrain macrosystems project.


Figures

Figure 1
Figure 1
Diagram illustrating the experimental protocol and resulting groups. Abbreviations: d,days; h,hours; IAC,investigator-administered cocaine; SAC,self-administered cocaine; SAS,self-administered saline.
Figure 2
Figure 2
Diagrams illustrating the 32 regions of interest (ROIs) subjected to computer-assisted counting in this study (a–t). ROIs are shown as boldly outlined rectangles or irregularly shaped areas, labeled with large, bold font, that conform to the size and shapes of the areas actually evaluated. ac,anterior commissure; Acb,accumbens; AI,agranular insular cortex; aq,cerebral acqueduct; BST,bed nucleus of stria terminalis; cc,corpus callosum; c,central division; BA,basal amygdaloid nucleus; Cbl,cerebellum; CeA,central nucleus of the amygdala; Cg,anterior cingulate cortex; co,core; cp,cerebral peduncle; Cpu,caudate-putamen; DG,dentate gyrus; dl,dorsolateral division; dm,dorsomedial division; DpMe,deep mesencephalic nucleus; f,fornix; fi,fimbria fornix; FL/HL,primary somatosensory cortex, forelimb/hindlimb area; fr,fasciculus retroflexus; GP,globus pallidus; Hip,hippocampus; HDB,horizontal limb of the diagonal band; I,intermediate division; ic,internal capsule; IPN,interpeduncular nucleus; Ith,intralaminar nuclei of the thalamus; l,lateral division; LA,lateral nucleus of the amygdala; lfp,longitudinal fasciculus of the pons; LHb,lateral habenula; LS,lateral septum; lot,lateral olfactory tract; LPO,lateral preoptic area; lv,lateral ventricle; m,medial division; mcp,medial cerebellar peduncle; MG,medial geniculate body; MI,first primary motor cortex; ml,medial lemniscus; mlf,medial longitundinal fasciculus; MnR,median raphe; MPO,medial preoptic area; MS,medial septum; mt,mammillothalamic tract; ot,optic tract; ox,optic chiasm; PAG,periacqeductal gray; PfC,prefrontal cortex; Pir,piriform cortex; Po,posterior nucleus of the thalamus; PPTg,pedunculopontine tegmental nucleus; PrL,prelimbic cortex; py,medullary pyramid; RMTg,rostromedial tegmental nucleus; RN,red nucleus; rp,rostral pole; RRF,retrorubral field; sh,shell; SIj,primary somatosensory cortex, jaw area; sm,stria medullaris; SNC,substantia nigra compacta; SNR,substantia nigra reticulata; spc,superior cerebellar peduncle; st,stria terminalis; STN,subthalamic nucleus; Tu,olfactory tubercle; v,ventral division; V,trigeminal nerve; VA,ventral anterior nucleus of the thalamus; VDB,vertical limb of the diagonal band; vl,ventrolateral division; VP,ventral pallidum; VPM,ventral posteromedial thalamic nucleus; VTA,ventral tegmental area; xscp,crossing of the superior cerebellar peduncle; ZI,zona incerta; II,optic tract; III,third ventricle; IV,fourth ventricle.
Figure 2
Figure 2
Diagrams illustrating the 32 regions of interest (ROIs) subjected to computer-assisted counting in this study (a–t). ROIs are shown as boldly outlined rectangles or irregularly shaped areas, labeled with large, bold font, that conform to the size and shapes of the areas actually evaluated. ac,anterior commissure; Acb,accumbens; AI,agranular insular cortex; aq,cerebral acqueduct; BST,bed nucleus of stria terminalis; cc,corpus callosum; c,central division; BA,basal amygdaloid nucleus; Cbl,cerebellum; CeA,central nucleus of the amygdala; Cg,anterior cingulate cortex; co,core; cp,cerebral peduncle; Cpu,caudate-putamen; DG,dentate gyrus; dl,dorsolateral division; dm,dorsomedial division; DpMe,deep mesencephalic nucleus; f,fornix; fi,fimbria fornix; FL/HL,primary somatosensory cortex, forelimb/hindlimb area; fr,fasciculus retroflexus; GP,globus pallidus; Hip,hippocampus; HDB,horizontal limb of the diagonal band; I,intermediate division; ic,internal capsule; IPN,interpeduncular nucleus; Ith,intralaminar nuclei of the thalamus; l,lateral division; LA,lateral nucleus of the amygdala; lfp,longitudinal fasciculus of the pons; LHb,lateral habenula; LS,lateral septum; lot,lateral olfactory tract; LPO,lateral preoptic area; lv,lateral ventricle; m,medial division; mcp,medial cerebellar peduncle; MG,medial geniculate body; MI,first primary motor cortex; ml,medial lemniscus; mlf,medial longitundinal fasciculus; MnR,median raphe; MPO,medial preoptic area; MS,medial septum; mt,mammillothalamic tract; ot,optic tract; ox,optic chiasm; PAG,periacqeductal gray; PfC,prefrontal cortex; Pir,piriform cortex; Po,posterior nucleus of the thalamus; PPTg,pedunculopontine tegmental nucleus; PrL,prelimbic cortex; py,medullary pyramid; RMTg,rostromedial tegmental nucleus; RN,red nucleus; rp,rostral pole; RRF,retrorubral field; sh,shell; SIj,primary somatosensory cortex, jaw area; sm,stria medullaris; SNC,substantia nigra compacta; SNR,substantia nigra reticulata; spc,superior cerebellar peduncle; st,stria terminalis; STN,subthalamic nucleus; Tu,olfactory tubercle; v,ventral division; V,trigeminal nerve; VA,ventral anterior nucleus of the thalamus; VDB,vertical limb of the diagonal band; vl,ventrolateral division; VP,ventral pallidum; VPM,ventral posteromedial thalamic nucleus; VTA,ventral tegmental area; xscp,crossing of the superior cerebellar peduncle; ZI,zona incerta; II,optic tract; III,third ventricle; IV,fourth ventricle.
Figure 3
Figure 3
Diagrams illustrating the behavior of the rats used in the study in terms of numbers of cocaine and saline infusions (a), numbers of responses (b) and (c) locomotor activity. Means and SEMs are shown.
Figure 4
Figure 4
Fluorescence micrographs of the central caudate-putamen (see Figure 2d) of an SAC 1 day rat illustrating localization of Fos-immunoreactive nuclei (a) within cells identified in panel (b) as neurons on the basis of immunoreactivity against the neuronal nuclear antigen (NeuN). An obliquely oriented arrowhead near a blood vessel (bv) marks the only Fos immunoreactive structure in the field not colocalized with a NeuN immunoreactive structure. Horizontally oriented arrowheads mark examples illustrating that NeuN immunoreactive structures, because NeuN often stains both the cell body and nucleus, are usually larger than the colocalized Fos-labeling. The disparity in the size and shape of co-localized Fos- and NeuN-immunoreactive structures, also apparent in the merged image (c) rules out the possibility that the near complete assocation of Fos-ir nuclei with NeuN structures is due to bleed-through of the FITC signal. Scale bar: 100 μm.
Figure 5
Figure 5
Photomicrographs illustrating Fos immunoreactive neurons in the accumbens (Acb) in the 1 (1 day) and 6 (6 day) day saline self-administration (SAS) groups and in the basal Fos expression group, which comprised rats that self-administered saline for 5 days and were killed on the sixth day with no further opportunity to self administer. b, d, and e are enlargements of the boxed areas in a, c, and e, respectively. co,Acb core; sh,Acb shell; ICjm,Island of Calleja magnus; lv,lateral ventricle. Scale bar: 1 mm in a, c, and e; 200 μm in b, d, and f.
Figure 6
Figure 6
Graphs illustrating the density of Fos-immunoreactive nuclei in the ventral striatopallidum (a), including the accumbens (Acb) and ventral pallidum (VP), and dorsal striatopallidum (b), including the caudate-putamen (CPu), globus pallidus (GP), subthalamic nucleus (STN), and substantia nigra reticulata (SNR), for the experimental groups as described in the text. Means and SEMs are shown (c) Cross-referenced results of ANOVA and LSD post hoc tests. •p<0.05; ••p<0.01. Widths of the horizontal bars reflect the magnitude of the SEM above and below the mean for ‘basal Fos' expression. c, central division of CPu; co, Acb core; IAC, investigator-administered cocaine; rp Acb, rostral pole; SAC, self-administered cocaine; SAS, self-administered saline; shvAcb, shell; vl, ventrolateral division of CPu.
Figure 7
Figure 7
Graphs illustrating the density of Fos-immunoreactive nuclei in the extended amygdala (a), including the bed nucleus of stria terminalis (BST) and central nucleus of the amygdala (CeA), and in (b) the lateral septum (LS), lateral habenula (LHb), and zona incerta (ZI), for the experimental groups as described in the text. Conventions in (a–c) are as in Figure 6. dl,dorsolateral division; dm,dorsomedial division; i,intermediate division; IAC,investigator-administered cocaine; l,lateral division; m,medial division; SAC,self-administered cocaine; SAS,self-administered saline; v,ventral division.
Figure 8
Figure 8
Graphs illustrating the density of Fos-immunoreactive nuclei in some structures in the upper brainstem (a), including the ventral tegmental area (VTA), rostromedial tegmental nucleus (RMTg), and pedunculopontine (PPTg) and laterodorsal (LDTg) tegmental nuclei, and in the hypothalamus (b), including the suprchiasmatic nucleus (SCN), supraoptic nucleus (SON) and paraventricular nucleus (PV), for the experimental groups as described in the text. Conventions in (a–c) are as in Figure 6. c,caudal division; IACv,investigator-administered cocaine; rv,rostral division; SAC,self-administered cocaine; SAS,self-administered saline.
Figure 9
Figure 9
(a-b) Graphs illustrating the density of Fos-immunoreactive nuclei in some cortical structures, including the piriform (Pir), prelimbic (PrL), anterior cingulate (ACg), and primary somatosensory (S1), for the experimental groups as described in the text. Conventions are as in Figure 6. FL/HL,forelimb/hindlimb area; IAC,investigator-administered cocaine; SAC,self-administered cocaine; SAS,self-administered saline.
Figure 10
Figure 10
Photomicrographs illustrating Fos immunoreactive neurons in the caudate-putamen (CPu) in the 1 (1d) and 6 (6d) day saline self-administration (SAS, panels a, b, e, and f) and cocaine self-administration (SAC, panels c, d, g, and h) groups. b, d, f, and h are enlargements of the boxed areas in a, c, e, and g, respectively. cc,corpus callosum; Cx,cortex; ic,internal capsule. Scale bar: 1 mm in a, c, e, and g; 200 μm in b, d, f, and h.
Figure 11
Figure 11
Photomicrographs illustrating Fos immunoreactive neurons in the accumbens (Acb) in the 1 (1d) and 6 (6d) day cocaine self-administration (SAC) groups. b and d are enlargements of the boxed areas in a and c, respectively. ac, anterior commissure; co,Acb core; sh, Acb shell; CPu,caudate-putamen; ICj,island of Calleja; ICjm,island of Calleja magnus; l,lateral ventricle. Scale bar: 1 mm in a, c, and e; 200 μm in b, d, and f.

Similar articles

Cited by

References

    1. Alheid GF, Heimer L. New perspectives in basal forebrain organization of special relevance for neuropsychiatric disorders: the striatopallidal, amygdaloid and corticopetal components of substantia innominata. Neuroscience. 1988;27:1–39. - PubMed
    1. Asmus SE, Newman SW. Colocalization of tyrosine hydroxylase and Fos in the male Syrian hamster brain following different states of arousal. J Neurobiol. 1994;25:156–168. - PubMed
    1. Balster RL. Abuse potential of buspirone and related drugs. J Clin Psychopharmacol. 1990;10:31S–37S. - PubMed
    1. Bauer LO, Kranzler HR. Electroencephalographic activity and mood in cocaine-dependent outpatients: effects of cocaine cue exposure. Biol Psychiat. 1994;36:189–197. - PubMed
    1. Bekavac I, Waterhouse BD. Systemically administered cocaine selectively enhances long-latency responses of rat barrel field cortical neurons to vibrissae stimulation. J Pharmacol Exp Ther. 1995;272:333–342. - PubMed

Publication types

MeSH terms