

doi: 10.1364/OL.34.002961.
Simultaneous multimodal imaging with integrated photoacoustic microscopy and optical coherence tomography
Affiliations
- PMID: 19794782
- PMCID: PMC2883610
- DOI: 10.1364/OL.34.002961
Item in Clipboard
Simultaneous multimodal imaging with integrated photoacoustic microscopy and optical coherence tomography
Opt Lett.
.
Abstract
We have developed a multimodal imaging technique by integrating photoacoustic microscopy and spectral-domain optical coherence tomography to provide simultaneous volumetric microscopic imaging of both optical absorption and scattering contrasts in biological tissues. In the integrated system, the two imaging modalities share the same optical scanning and delivery mechanisms after their probing and illumination light beams are combined. By further synchronizing the image acquisitions, the images from the two modalities are intrinsically registered. The capabilities of this novel technique were demonstrated by imaging both the microanatomy and microvasculature in mouse ears in vivo.
Figures

(Color online) Schematic of the integrated PAM and OCT experimental system. SLD, superluminescent diode; PC, polarization controller; PD, photodiode; FOV, field of view; UT, ultrasonic transducer.
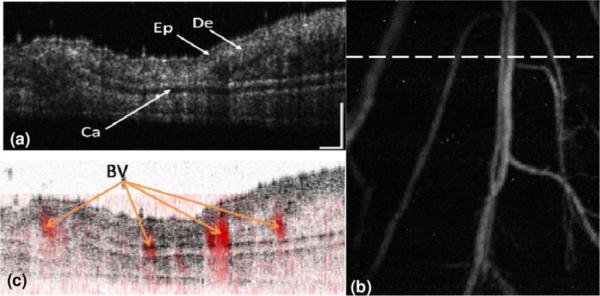
(Color online) Simultaneously acquired OCT and PAM images of a mouse ear. (a) OCT B-scan at the location marked in panel (b) by the dashed line (displayed dynamic range, 45 dB); (b) PAM image (average contrast-to-noise ratio 32 dB); (c) fused OCT and PAM B-scan images at the same location. Ep, epidermis; De, dermis; Ca, cartilaginous backbone; BV, blood vessels; bar, 200 μm.
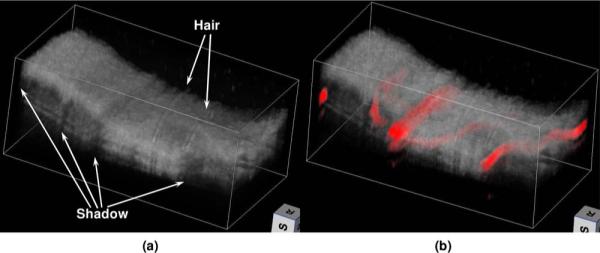
(Color online) Volume renderings of (a) the OCT data and (b) the final fused image. In the fused image, the blood vessels are pseudocolored red, and the opacity of the OCT voxels is set to 0.8.
References
-
- Zhang HF, Maslov K, Wang LV. Nat. Protoc. 2007;4:797. - PubMed
-
- Zhang HF, Maslov K, Stoica G, Wang LV. Nat. Biotechnol. 2006;24:848. - PubMed
-
- Maslov K, Zhang HF, Hu S, Wang LV. Opt. Lett. 2008;33:929. - PubMed
-
- Wojtkowski M, Srinivasan V, Ko T, Fujimoto J, Kowalczyk A, Duker J. Opt. Express. 2004;12:2404. - PubMed
Publication types
MeSH terms
Grants and funding
LinkOut - more resources
Full Text Sources
Other Literature Sources
