

Kinetic analysis of 5 sugar probes in dog serum after orogastric administration
- PMID: 19794895
- PMCID: PMC2705077
Kinetic analysis of 5 sugar probes in dog serum after orogastric administration
Abstract
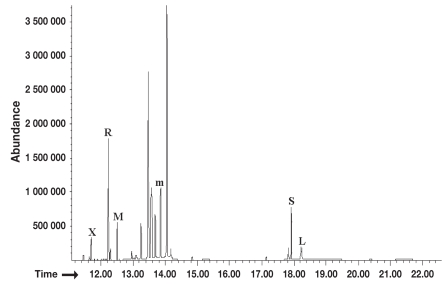
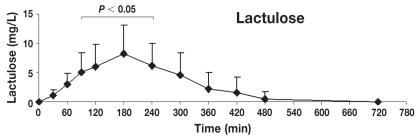
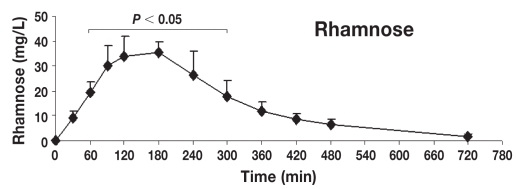
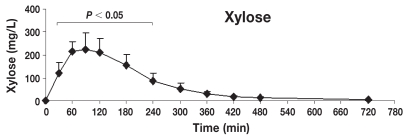
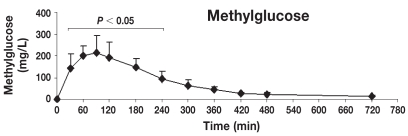
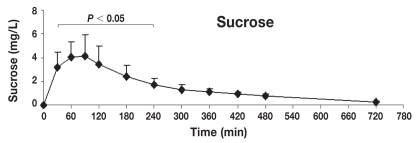
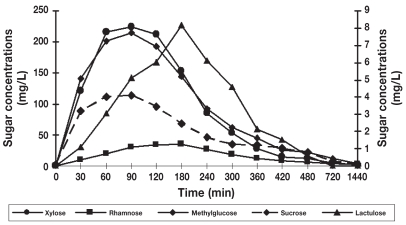
The objective of this study was to describe the kinetics of orally administered sugar probes in serum for the assessment of gastrointestinal permeability and intestinal absorptive capacity in dogs. Eight healthy dogs received lactulose (L), rhamnose (R), methylglucose (M), xylose (X), and sucrose (S) by orogastric intubation. Baseline blood samples and subsequently timed blood samples were taken during 24 hours. Sugars were analyzed by gas chromatography-mass spectrometry (GC-MS). Statistical analysis was performed using a Friedman test with Dunn's multiple comparison post test and a Kruskal-Wallis test. Statistical significance was set at a P-value < 0.05. Sugars in serum were detected after orogastric administration. Concentrations of L and R were significantly different from the baseline from 90 to 240 and 60 to 300 min, respectively, and those of X, M, and S were different from 30 to 240 min post-dosing (P < 0.05 for all 5 probes). Maximum concentrations of L and R were obtained at 180 min, while X, M, and S reached their maximum concentrations at 90 min post-dosing. For all sugars, no statistically significant differences were found between concentrations at 90, 120, and 180 min or between the coefficients of variation (CV%) of those mean concentrations for these 3 time points. Based on these data, the collection of 2 blood samples, one taken at baseline and the other obtained between 90 and 180 minutes after dosing, might be sufficient for the determination of gastrointestinal permeability and mucosal absorptive capacity using these 5 sugar probes in canine serum.
L’objectif de la présente étude était de décrire la cinétique sérique de sucres sondes administrés oralement pour l’évaluation de la perméabilité gasto-intestinale et de la capacité d’absorption chez le chien. Huit chiens en santé ont reçu du lactulose (L), du rhamnose (R), du méthyl-glucose (M), du xylose (X) et du sucrose (S) par intubation orogastrique. Des échantillons sanguins pour les valeurs de base et des échantillons subséquents chronométrés ont été prélevés sur une période de 24 heures. Les sucres ont été analysés par chromatographie gazeuse-spectre de masse (GC-MS). Une analyse statistique a été effectuée en utilisant le test de Friedman avec une comparaison post-test multiple de Dunn et un test de Kruskal-Wallis. Le seuil de signification a été fixé à une valeur de P < 0,05. Les sucres dans le sérum ont été détectés après administration orogastrique. Les concentrations de L et R étaient significativement différentes des valeurs de base, respectivement, entre 90 et 240 et 60 et 300 min, et celles de X, M et S étaient différentes entre 30 et 240 min post-administration (P < 0,05 pour les 5 sondes). Les concentrations maximales de L et R ont été obtenues à 180 min, alors que celles de X, M et S ont atteint leur maximum 90 min post-administration. Pour tous les sucres, aucune différence significative n’a été trouvée entre les concentrations à 90, 120 et 180 min ou entre les coefficients de variation (%CV) des concentrations moyennes pour ces 3 coordonnées temporelles. Sur la base de ces données, le dosage de ces 5 sucres sondes dans 2 prélèvement sanguins, le premier au temps 0 et le second 90 à 180 min après l’administration du sucre, pourrait être suffisant pour déterminer la perméabilité et la capacité d’absorption de la muqueuse gastro-intestinale.
(Traduit par Docteur Serge Messier)
Figures
Similar articles
-
Kinetics of urinary recovery of five sugars after orogastric administration in healthy dogs.Am J Vet Res. 2002 Jun;63(6):845-8. doi: 10.2460/ajvr.2002.63.845. Am J Vet Res. 2002. PMID: 12061531
-
Development and analytic validation of a gas chromatography-mass spectrometry method for the measurement of sugar probes in canine serum.Am J Vet Res. 2009 Mar;70(3):320-9. doi: 10.2460/ajvr.70.3.320. Am J Vet Res. 2009. PMID: 19254142
-
Evaluation of gastrointestinal permeability and mucosal absorptive capacity in dogs with chronic enteropathy.Am J Vet Res. 2006 Mar;67(3):479-83. doi: 10.2460/ajvr.67.3.479. Am J Vet Res. 2006. PMID: 16506911
-
Assessment of intestinal permeability and absorption in cirrhotic patients with ascites using combined sugar probes.Dig Dis Sci. 2004 Apr;49(4):621-6. doi: 10.1023/b:ddas.0000026307.56909.21. Dig Dis Sci. 2004. PMID: 15185867
-
Development and validation of an LC-MS/MS method for the quantification of oral-sugar probes in plasma to test small intestinal permeability and absorptive capacity in the domestic cat (Felis catus).J Chromatogr B Analyt Technol Biomed Life Sci. 2024 Jul 15;1242:124216. doi: 10.1016/j.jchromb.2024.124216. Epub 2024 Jun 22. J Chromatogr B Analyt Technol Biomed Life Sci. 2024. PMID: 38917651
Cited by
-
Laboratory tests for diagnosis of gastrointestinal and pancreatic diseases.Top Companion Anim Med. 2011 May;26(2):86-97. doi: 10.1053/j.tcam.2011.02.005. Top Companion Anim Med. 2011. PMID: 21596348 Free PMC article. Review.
References
-
- Bjarnason I, MacPherson A, Hollander D. Intestinal permeability: An overview. Gastroenterology. 1995;108:1566–1581. - PubMed
-
- Daugherty AL, Mrsny R. Transcellular uptake mechanisms of the intestinal epithelial barrier: Part one. Pharm Sci Technol Today. 1999;4:144–151. - PubMed
-
- Kararli TT. Comparison of the gastrointestinal anatomy, physiology, and biochemistry of humans and commonly used laboratory animals. Biopharm Drug Dispos. 1995;16:351–380. - PubMed
-
- Unno N, Fink MP. Intestinal epithelial hyperpermeability. Mechanisms and relevance to disease. Gastro Clin N Am. 1998;27:289–307. - PubMed
MeSH terms
Substances
LinkOut - more resources
Full Text Sources
Other Literature Sources
Miscellaneous