

8p22 MTUS1 gene product ATIP3 is a novel anti-mitotic protein underexpressed in invasive breast carcinoma of poor prognosis
- PMID: 19794912
- PMCID: PMC2749209
- DOI: 10.1371/journal.pone.0007239
8p22 MTUS1 gene product ATIP3 is a novel anti-mitotic protein underexpressed in invasive breast carcinoma of poor prognosis
Abstract
Background: Breast cancer is a heterogeneous disease that is not totally eradicated by current therapies. The classification of breast tumors into distinct molecular subtypes by gene profiling and immunodetection of surrogate markers has proven useful for tumor prognosis and prediction of effective targeted treatments. The challenge now is to identify molecular biomarkers that may be of functional relevance for personalized therapy of breast tumors with poor outcome that do not respond to available treatments. The Mitochondrial Tumor Suppressor (MTUS1) gene is an interesting candidate whose expression is reduced in colon, pancreas, ovary and oral cancers. The present study investigates the expression and functional effects of MTUS1 gene products in breast cancer.
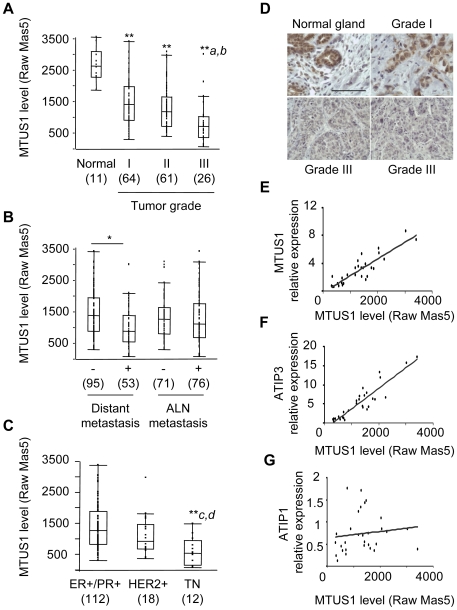
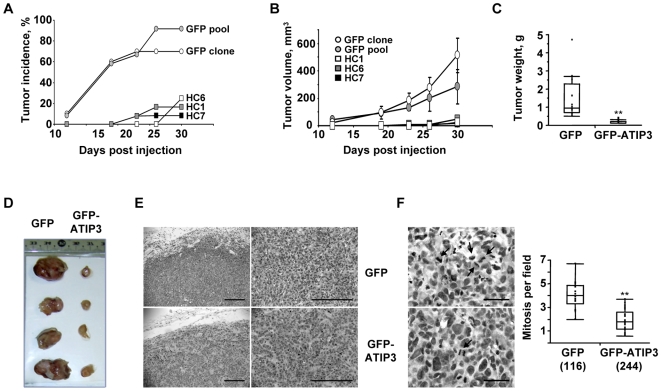
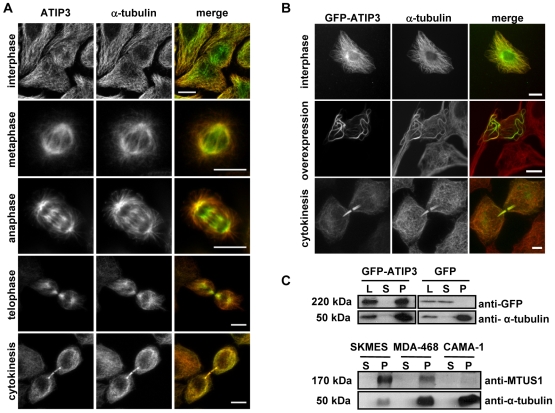
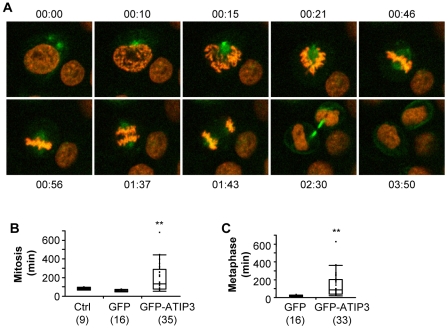
Methods and findings: By means of gene array analysis, real-time RT-PCR and immunohistochemistry, we show here that MTUS1/ATIP3 is significantly down-regulated in a series of 151 infiltrating breast cancer carcinomas as compared to normal breast tissue. Low levels of ATIP3 correlate with high grade of the tumor and the occurrence of distant metastasis. ATIP3 levels are also significantly reduced in triple negative (ER- PR- HER2-) breast carcinomas, a subgroup of highly proliferative tumors with poor outcome and no available targeted therapy. Functional studies indicate that silencing ATIP3 expression by siRNA increases breast cancer cell proliferation. Conversely, restoring endogenous levels of ATIP3 expression leads to reduced cancer cell proliferation, clonogenicity, anchorage-independent growth, and reduces the incidence and size of xenografts grown in vivo. We provide evidence that ATIP3 associates with the microtubule cytoskeleton and localizes at the centrosomes, mitotic spindle and intercellular bridge during cell division. Accordingly, live cell imaging indicates that ATIP3 expression alters the progression of cell division by promoting prolonged metaphase, thereby leading to a reduced number of cells ungergoing active mitosis.
Conclusions: Our results identify for the first time ATIP3 as a novel microtubule-associated protein whose expression is significantly reduced in highly proliferative breast carcinomas of poor clinical outcome. ATIP3 re-expression limits tumor cell proliferation in vitro and in vivo, suggesting that this protein may represent a novel useful biomarker and an interesting candidate for future targeted therapies of aggressive breast cancer.
Conflict of interest statement
Figures

Similar articles
-
ATIP3, a novel prognostic marker of breast cancer patient survival, limits cancer cell migration and slows metastatic progression by regulating microtubule dynamics.Cancer Res. 2013 May 1;73(9):2905-15. doi: 10.1158/0008-5472.CAN-12-3565. Epub 2013 Feb 8. Cancer Res. 2013. PMID: 23396587
-
Improving breast cancer sensitivity to paclitaxel by increasing aneuploidy.Proc Natl Acad Sci U S A. 2019 Nov 19;116(47):23691-23697. doi: 10.1073/pnas.1910824116. Epub 2019 Nov 4. Proc Natl Acad Sci U S A. 2019. PMID: 31685623 Free PMC article.
-
Combinatorial expression of microtubule-associated EB1 and ATIP3 biomarkers improves breast cancer prognosis.Breast Cancer Res Treat. 2019 Feb;173(3):573-583. doi: 10.1007/s10549-018-5026-1. Epub 2018 Oct 27. Breast Cancer Res Treat. 2019. PMID: 30368744
-
Microtubule-Associated Protein ATIP3, an Emerging Target for Personalized Medicine in Breast Cancer.Cells. 2021 May 1;10(5):1080. doi: 10.3390/cells10051080. Cells. 2021. PMID: 34062782 Free PMC article. Review.
-
Mutation analysis of the 8p22 candidate tumor suppressor gene ATIP/MTUS1 in hepatocellular carcinoma.Mol Cell Endocrinol. 2006 Jun 27;252(1-2):207-15. doi: 10.1016/j.mce.2006.03.014. Epub 2006 May 2. Mol Cell Endocrinol. 2006. PMID: 16650523 Review.
Cited by
-
Detection of metals and metalloproteins in the plasma of stroke patients by mass spectrometry methods.Metallomics. 2012 Oct;4(10):1077-87. doi: 10.1039/c2mt20092a. Epub 2012 Sep 14. Metallomics. 2012. PMID: 22983496 Free PMC article.
-
Reduced expression of MTUS1 mRNA is correlated with poor prognosis in bladder cancer.Oncol Lett. 2012 Jul;4(1):113-118. doi: 10.3892/ol.2012.673. Epub 2012 Apr 5. Oncol Lett. 2012. PMID: 22807972 Free PMC article.
-
The role of the basal stem cell of the human breast in normal development and cancer.Adv Exp Med Biol. 2011;720:121-34. doi: 10.1007/978-1-4614-0254-1_10. Adv Exp Med Biol. 2011. PMID: 21901623 Free PMC article. Review.
-
8p deletion is strongly linked to poor prognosis in breast cancer.Cancer Biol Ther. 2015;16(7):1080-7. doi: 10.1080/15384047.2015.1046025. Epub 2015 May 11. Cancer Biol Ther. 2015. PMID: 25961141 Free PMC article.
-
Low-Level Expression of MTUS1 Is Associated with Poor Survival in Patients with Lung Adenocarcinoma.Diagnostics (Basel). 2021 Jul 13;11(7):1250. doi: 10.3390/diagnostics11071250. Diagnostics (Basel). 2021. PMID: 34359333 Free PMC article.
References
-
- Dowsett M, Dunbier AK. Emerging biomarkers and new understanding of traditional markers in personalized therapy for breast cancer. Clin Cancer Res. 2008;14:8019–8026. - PubMed
-
- Rakha EA, Reis-Filho JS, Ellis IO. Basal-like breast cancer: a critical review. J Clin Oncol. 2008;26:2568–2581. - PubMed
-
- Sotiriou C, Pusztai L. Gene-expression signatures in breast cancer. N Engl J Med. 2009;360:790–800. - PubMed
-
- Perou CM, Sørlie T, Eisen MB, van de Rijn M, Jeffrey SS, et al. Molecular portraits of human breast tumours. Nature. 2000;406:747–752. - PubMed
Publication types
MeSH terms
Substances
LinkOut - more resources
Full Text Sources
Other Literature Sources
Medical
Molecular Biology Databases
Research Materials
Miscellaneous
