. 2009 Oct;11(10):1042-53.
doi: 10.1593/neo.09760.

Decorin suppresses prostate tumor growth through inhibition of epidermal growth factor and androgen receptor pathways

Affiliations

Decorin suppresses prostate tumor growth through inhibition of epidermal growth factor and androgen receptor pathways

Yunping Hu et al. Neoplasia. 2009 Oct.

Abstract

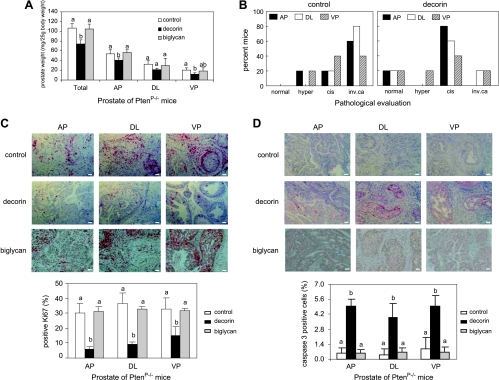
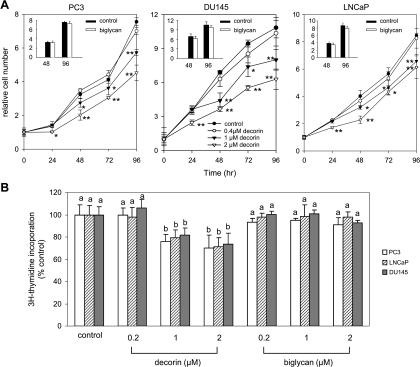
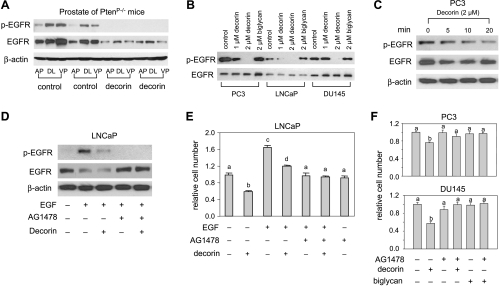
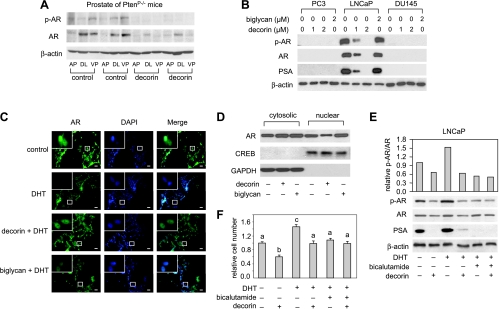
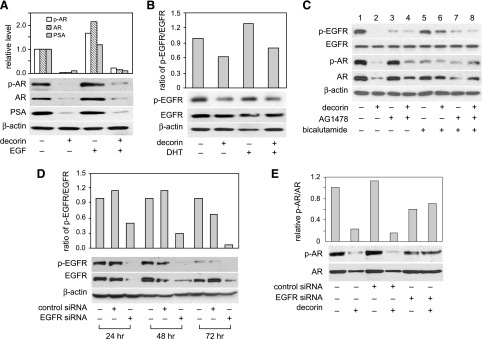
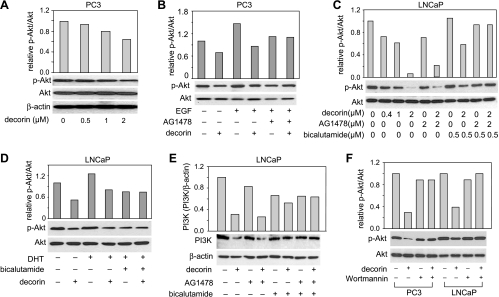
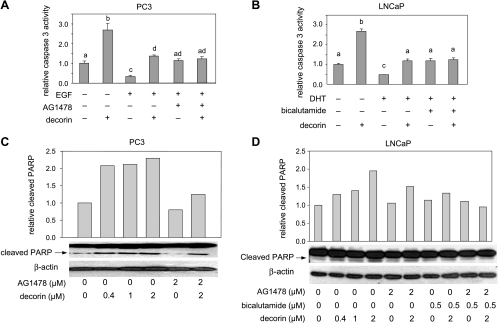
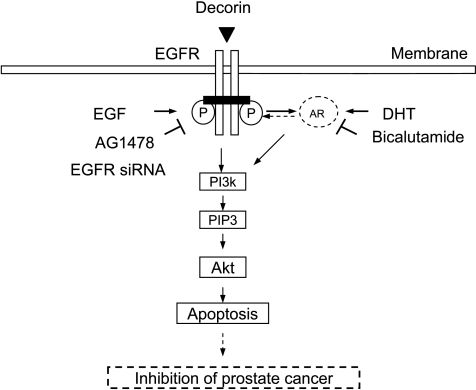
Epidermal growth factor receptor (EGFR) and androgen receptor (AR) pathways play pivotal roles in prostate cancer progression. Therefore, agents with dual-targeting ability may have important therapeutic potential. Decorin, a proteoglycan present in the tumor microenvironment, is known to regulate matrix assembly, growth factor binding, and receptor tyrosine kinase activity. Here, we show that in prostate-specific Pten(P-/-) mice, a genetically defined, immune-competent mouse model of prostate cancer, systemic delivery of decorin inhibits tumor progression by targeting cell proliferation and survival pathways. Moreover, in human prostate cancer cells, we show that decorin specifically inhibits EGFR and AR phosphorylation and cross talk between these pathways. This prevents AR nuclear translocation and inhibits the production of prostate specific antigen. Further, the phosphatidylinositol-3 kinase (PI3K)/Akt cell survival pathway is suppressed leading to tumor cell apoptosis. Those findings highlight the effectiveness of decorin in the presence of a powerful genetic cancer risk and implicate decorin as a potential new agent for prostate cancer therapy by targeting EGFR/AR-PI3K-Akt pathways.


Figures

Figure 1
Figure 1
Exogenous decorin core protein inhibited the growth of prostate tumor in PtenP-/- mice. (A) Mice (n = 5 mice each group) were treated with decorin (10 mg/kg body weight), biglycan (10 mg/kg body weight), or saline through intraperitoneal injection for 12 weeks after weaning. The anterior (AP), dorsolateral (DL), and ventral (VP) prostate lobes were weighed and calculated as milligrams per 25-g body weight. Data were expressed as means ± SD and analyzed by one-way analysis of variance. Values with different letters are significantly different (P < .05). (B) Prostate grading of 10 PtenP-/- mice treated with either decorin (10 mg/kg body weight) or saline (control) was analyzed in AP, DL, and VP lobes using a double-blind method. When complex histologic diagnosis was found, the most advanced type was indicated. cis indicates carcinoma in situ; hyper, hyperplasia; inv. ca, invasive adenocarcinoma. (C) PtenP-/- mice treated with decorin (10 mg/kg body weight), biglycan (10 mg/kg body weight), or saline were randomly selected to analyze cell proliferation in prostate glands using immunohistochemistry with anti-Ki-67 antibody. Photos are representative of results obtained from three mice per group. Scale bar, 100 µm. Histograms at bottom show quantification of Ki-67-positive cells. (D) PtenP-/- mice treated with decorin (10 mg/kg body weight), biglycan (10 mg/kg body weight), or saline were randomly selected to measure apoptosis in prostate glands using immunohistochemistry with anti-cleaved caspase 3 antibodies. Photos are representative of results obtained from three mice per group. Scale bar, 100 µm. Histograms at the bottom show quantification of cleaved caspase 3-positive cells.
Figure 2
Figure 2
Decorin inhibited the growth of human prostate cancer cells. (A) PC3, DU145, and LNCaP cells were treated with decorin (0, 0.4, 1, and 2 µM) or biglycan (2 µM, insets), and cell number was measured as absorbance at 490 nm at the indicated times using MTS assay. Data are expressed as fold increases relative to pretreatment (0 time) for each treatment. *P < .05 or **P < .01, compared with control at the same observed time point. (B) PC3, DU145, and LNCaP cells were treated with decorin or biglycan at 0.2, 1, and 2 µM for 24 hours. DNA synthesis was measured by [3H]-thymidine incorporation. Values shown are thymidine incorporation as a percent of control (no decorin) and represent mean ± SD (n = 3). Values with different letters are significantly different (P < .05).
Figure 3
Figure 3
Decorin inhibited EGFR and EGFR phosphorylation in prostate of PtenP-/- mice and human prostate cancer cells. (A) Prostate tissues from AP, DL, and VP of PtenP-/- mice treated with decorin or saline (n = 2 mice each group) were homogenized with lysis buffer containing protease and phosphatase inhibitors. Protein extracts was analyzed by Western blots for EGFR, EGFR phosphorylation (Tyr 1068), and β-actin. (B) Cells were treated with decorin (1 and 2 µM) or biglycan (2 µM) for 48 hours. The cells were lysed, and EGFR and its phosphorylation (p-EGFR, Tyr 1068) were measured by Western blot analysis of 20-µg per well protein aliquots. Data shown are representative of three experiments with similar results. (C) PC3 cells were treated with decorin (2 µM) for 5, 10, or 20 minutes. Total proteins were used to measure EGFR and EGFR phosphorylation (Tyr 1068) by Western blot assay. Results are representative of two independent experiments. (D) LNCaP cells were treated with decorin (2 µM), AG1478 (2 µM), and/or EGF (100 ng/ml) for 10 minutes. Total proteins were analyzed by Western blot analysis with anti-phospho-EGFR (Tyr 1068) or anti-total EGFR antibodies. Results are representative of two independent experiments. (E) Cells were exposed to decorin (2 µM), biglycan (2 µM), AG1478 (2 µM), and/or EGF (100 ng/ml) for 48 hours. Cell number was measured by MTS. Values representing the mean ± SD (n = 4) with different letters indicate significant differences (P < .05). (F) PC3 and DU145 cells were exposed to EGFR kinase inhibitor, AG1478 (2 µM, pretreated for 30 minutes), decorin (2 µM), or biglycan (2 µM). Cell number was measured by MTS after 72 hours. Values representing the mean ± SD (n = 4) with different letters indicate significant differences (P < .05).
Figure 4
Figure 4
Decorin inhibited AR and production of PSA in prostate of PtenP-/- mice and LNCaP cells. (A) Protein extracts from prostate of PtenP-/- mice treated with decorin or saline (two mice in each group randomly selected) was used for Western blot analysis of AR, AR phosphorylation, and β-actin. (B) PC3, LNCaP, and DU145 cells were treated with decorin (1 and 2 µM) or biglycan (2 µM) for 48 hours. AR, AR phosphorylation (p-AR), and PSA proteins were measured by Western blots. Data shown are representative of two experiments with similar results. (C) LNCaP cells were seeded on coverslips in 24-well plates at the density of 5 x 10⁴ cells per milliliter and treated with decorin (2 µM) or biglycan (2 µM) for 24 hours followed by 1 nM DHT for 2 hours. Cells were then incubated with anti-AR antibody and visualized by Alexa Fluor 488 goat antirabbit immunoglobulin G and 4′,6-diamidino-2-phenylindole staining. Representative photos of LNCaP cells were treated as indicated. Scale bar, 100 µm. Insets: High-magnification images of the areas in the white rectangles. Data shown are representative of two experiments. (D) LNCaP cells were exposed to decorin (2 µM) or biglycan (2 µM) for 24 hours. Cytosolic and nuclear proteins were extracted and AR was measured by Western blot analysis. Data shown are representative of three independent experiments. (E) LNCaP cells were treated with decorin and bicalutamide (0.5 µM, pretreated for 90 minutes) for 48 hours followed by DHT (1 nM) for 2 hours, and total proteins were isolated. AR, p-AR, and PSA were measured by Western blot assay. Data shown are representative of two independent experiments. (F) The growth of LNCaP cells was measured by MTS assay after treatment with DHT (1 nM), bicalutamide (0.5 µM), and decorin (2 µM) for 48 hours. Values representing the mean ± SD (n = 3) with different letters are significantly different (P < .05).
Figure 5
Figure 5
Decorin impacted the cross talk between EGFR and AR in LNCaP cells. (A) LNCaP cells were treated with decorin (2 µM) for 48 hours followed by EGF (100 ng/ml) for 15 minutes. Total protein (20 µg/lane) was used for Western blot analysis of AR, p-AR, and PSA. (B) LNCaP cells were exposed to decorin (2 µM) for 48 hours followed by DHT (1 nM) for 2 hours. Total protein was used for measurement of EGFR and p-EGFR (Tyr 1068). (C) LNCaP cells were treated with decorin (2 µM) or AG1478 (2 µM, pretreated for 30 minutes) or bicalutamide (0.5 µM, pretreated for 90 minutes) for 48 hours. AR, p-AR, PSA, EGFR, and p-EGFR (Tyr 1068) were measured by Western blot assay. (D) LNCaP cells were transfected with control siRNA or EGFR siRNA for 6 hours, then supplemented with growth medium containing 1% FBS for 24 hours. Cells were incubated with EGF (100 ng/ml) for 15 minutes before harvest. EGFR and p-EGFR (Tyr 1068) were measured by Western blot assay. (E) Cells were transfected with control siRNA or EGFR siRNA for 24 hours, then treated with decorin (2 µM) for 48 hours. AR and p-AR were measured as described before. All data shown are representative of two independent experiments.
Figure 6
Figure 6
Decorin inhibited PI3K/Akt pathway through EGFR/AR in PC3 and LNCaP cells. (A) PC3 cells were treated with decorin for 48 hours. Protein extracts were used for Western blot analysis of total Akt and Akt phosphorylation (p-Akt, Ser 473). (B) PC3 cells were treated with decorin (2 µM) or AG1478 (2 µM, pretreated for 30 minutes) either alone or together for 48 hours followed by EGF (100 ng/ml) for 15 minutes. Total protein was used to measure total Akt and p-Akt. (C) LNCaP cells were incubated with decorin (0.4, 1, and 2 µM), AG1478 (2 µM, pretreated for 30 minutes), or bicalutamide (0.5 µM, pretreated for 90 minutes) either alone or together for 48 hours. Total protein was used for Western blot analysis of total Akt and p-Akt. (D) LNCaP cells were exposed to decorin and bicalutamide (0.5 µM, pretreated for 90 minutes) for 48 hours followed by 1 nM DHT for 2 hours. Total protein was used for Western blot analysis of total Akt and p-Akt. (E) LNCaP cells were treated with decorin (2 µM), AG1478 (2 µM, pretreated for 30 minutes), or bicalutamide (0.5 µM, pretreated for 90 minutes) either alone or together for 24 hours. The cells were lysed, and PI3K was measured by Western blot assay. (F) PC3 and LNCaP cells were pretreated with PI3K inhibitor, wortmannin (50 nM), for 30 minutes followed by decorin (2 µM) treatment of 48 hours. Total Akt and p-Akt were measured by Western blot assay. All data shown are representative of two independent experiments.
Figure 7
Figure 7
Decorin induced apoptosis by targeting EGFR and AR. (A) PC3 cells were treated with decorin (2 µM) or AG1478 (2 µM, pretreated for 30 minutes) followed by EGF (100 ng/ml) for 48 hours. Caspase 3 activity was measured with the Caspase-Glo 3/7 assay. Values representing the mean ± SD (n = 3) with different letters are significantly different (P < .05). (B) LNCaP cells were treated with decorin (2 µM) for 48 hours in the presence or absence of pretreatment with AG1478 (2 µM for 30 minutes), bicalutamide (0.5 µM for 90 minutes), or a combination of both. Caspase 3 activity was measured with the Caspase-Glo 3/7 assay. Values representing the mean ± SD (n = 3) with different letters are significantly different (P < .05). (C) PC3 cells were treated with decorin or the EGFR inhibitor, AG1478 (2 µM, pretreated for 30 minutes), for 48 hours, then cleaved PARP was measured by Western blot assay. Data shown are representative of two experiments with similar results. (D) LNCaP cells were treated with decorin for 72 hours in the presence or absence of pretreatment with AG1478 (2 µM for 30 minutes), bicalutamide (0.5 µM for 90 minutes), or a combination of both. Cleaved PARP was identified by Western analysis. Data shown (C and D) are representative of two independent experiments.
Figure 8
Figure 8
A schematic diagram illustrating signal transduction associated with the inhibitory effect of decorin on prostate tumor cell growth.

Similar articles

Cited by

References

    1. Mimeault M, Batra SK. Recent advances on multiple tumorigenic cascades involved in prostatic cancer progression and targeting therapies. Carcinogenesis. 2006;27:1–22. - PubMed
    1. Chung LW, Baseman A, Assikis V, Zhau HE. Molecular insights into prostate cancer progression: the missing link of tumor microenvironment. J Urol. 2005;173:10–20. - PubMed
    1. Ferdous Z, Wei VM, Iozzo R, Hook M, Grande-Allen KJ. Decorin-transforming growth factor-interaction regulates matrix organization and mechanical characteristics of three-dimensional collagen matrices. J Biol Chem. 2007;282:35887–35898. - PubMed
    1. Köninger J, Giese NA, Bartel M, di Mola FF, Berberat PO, di Sebastiano P, Giese T, Büchler MW, Friess H. The ECM proteoglycan decorin links desmoplasia and inflammation in chronic pancreatitis. J Clin Pathol. 2006;59:21–27. - PMC - PubMed
    1. Järveläinen H, Puolakkainen P, Pakkanen S, Brown EL, Höök M, Iozzo RV, Sage EH, Wight TN. A role for decorin in cutaneous wound healing and angiogenesis. Wound Repair Regen. 2006;14:443–452. - PubMed

Publication types

MeSH terms