. 2009 Oct;11(10):1106-15.
doi: 10.1593/neo.09934.

Systemic sclerosis-endothelial cell antiangiogenic pentraxin 3 and matrix metalloprotease 12 control human breast cancer tumor vascularization and development in mice

Affiliations

Systemic sclerosis-endothelial cell antiangiogenic pentraxin 3 and matrix metalloprotease 12 control human breast cancer tumor vascularization and development in mice

Francesca Margheri et al. Neoplasia. 2009 Oct.

Abstract

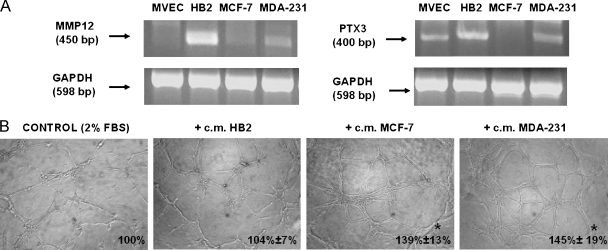
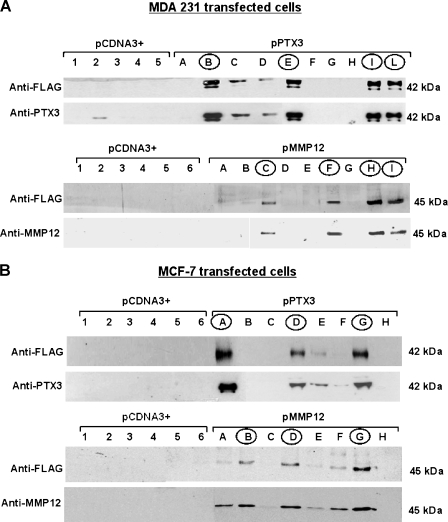
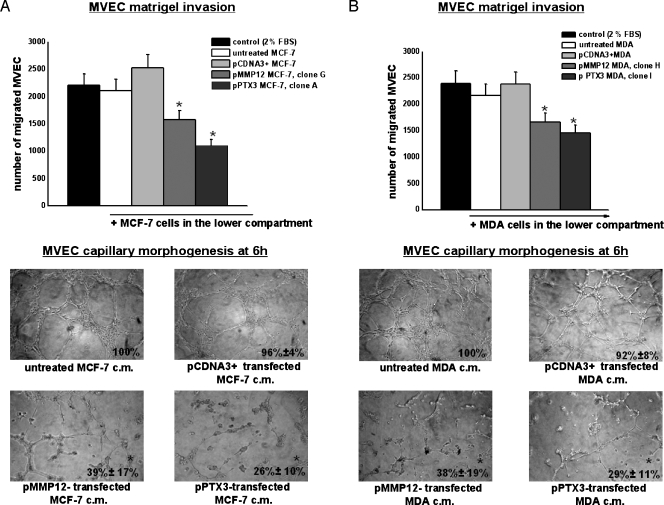
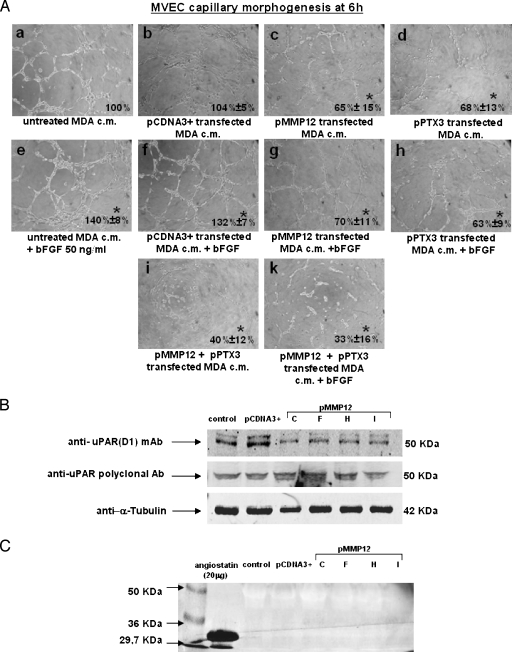
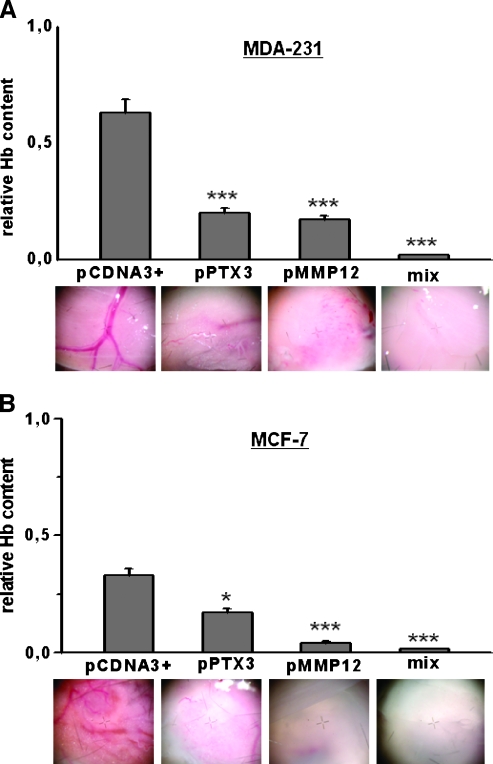
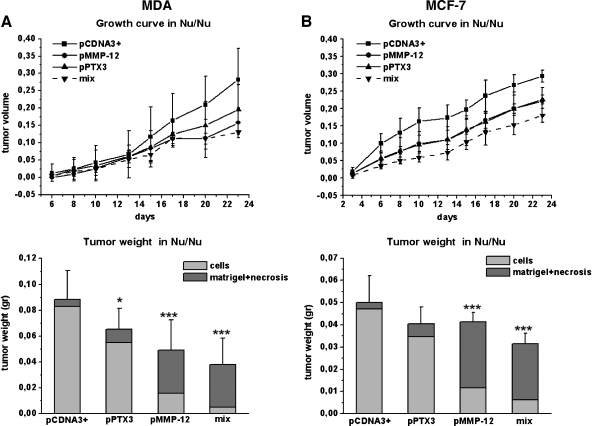
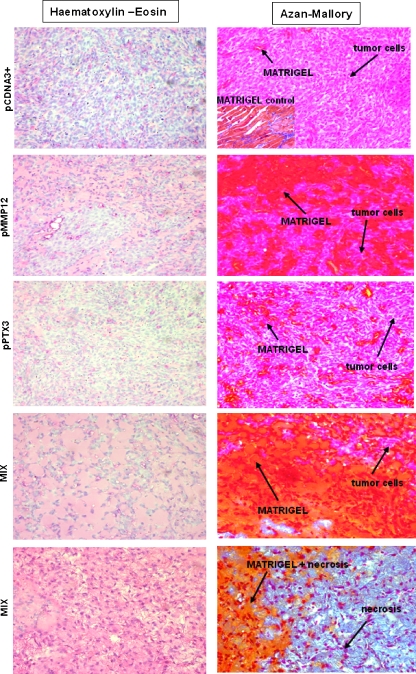
We have previously shown that endothelial cell matrix metalloprotease 12 (MMP12) and pentraxin 3 (PTX3) overproduction is the main alteration accounting for reduced proneness to angiogenesis in systemic sclerosis (SSc). On this basis, we stably transfected MMP12 and PTX3 in two breast cancer cell lines expressing very low amounts of the target molecules when compared with normal breast epithelial cells, relying on the hypothesis that antiangiogenic molecules released by cancer cells could confer an SSc-like antiangiogenic pattern on target endothelial cells. In Matrigel Boyden chamber invasion and capillary morphogenesis studies, transfected clones reduced endothelial cell invasion and capillary tube formation, which were abolished by tumor cell populations expressing both molecules. The Matrigel sponge assay, performed in vivo in C57/BL6 mice by injecting aliquots of lyophilized culture medium of transfected clones, indicated a similar reduction in angiogenesis. Functional studies have shown that endothelial cells treated with a culture medium of MMP12-expressing clones underwent cleavage of urokinase-type plasminogen activator receptor domain 1 which is indispensable to angiogenesis. We did not observe angiostatin production from plasminogen under the same experimental conditions. PTX3-overexpressing clones showed a powerful anti-fibroblast growth factor 2 (FGF2) activity in FGF2-dependent capillary morphogenesis. We have injected control and transfected clones into nude nu/nu (CD-1) BR mice to study the differential tumor growth pattern. We observed a reduction of tumor growth in transfected clones, which was basically complete when clones expressing both molecules were simultaneously injected. The extent of tumor necrosis suggested an antiangiogenesis-dependent inhibition of tumor development.


Figures

Figure 1
Figure 1
Expression of MMP12 and PTX3 in MVECs, in breast normal cells, and carcinoma cells and capillary morphogenesis activity of their CM. (A) Semiquantitative PCR of MMP12 and PTX3 complementary DNA in the indicated cells. Numbers on the left indicate the size of PCR products in base pairs (bp). GAPDH indicates glyceraldehyde-3-phosphate dehydrogenase. (B) Constitutive capillary morphogenesis activity of normal and breast epithelial cells (HB2) and of breast cancer cells at 6 hours after seeding. Pictures show the results of a typical experiment of three experiments performed in triplicate. Numbers on the lower right side of each picture indicate the percent field occupancy of capillary plexus as described in the Materials and Methods section. Quantification was performed only at 6 hours after seeding and was obtained by scanning of six to nine photographic fields for each condition.
Figure 2
Figure 2
Stable transfection of breast carcinoma cellswithMMP12 and PTX3. (A and B) Western blot analysis ofMDA-MB-231 and ofMCF-7 cells, respectively, to identify transfected clones. Each panel shows Western blot analysis for PTX3 and MMP12 expressed by transfected clones, identified either with anti-PTX3 and anti-MMP12 mAbs or with anti-FLAG antibodies. pCDNA3+ clones are marked with numbers, whereas pPTX3 and pMMP12 clones are indicated with capital letters. pPTX3 and pMMP12 clones selected on the basis of relevant protein expression of the transfected plasmid are encircled. Numbers on the right indicate molecular weights expressed in kilodaltons.
Figure 3
Figure 3
MMP12- and PTX3-transfected breast carcinoma cells-dependent Matrigel invasion and capillary morphogenesis of MVEC. (A) Upper part of the figure shows Matrigel invasion of MVEC added to the upper compartment of the migration chamber in the presence of MCF-7 cells transfected with pMMP12 (clone G) and with pPTX3 (clone A). Results are the mean of three different experiments performed in triplicate. Similar results were also obtained with MCF-7 clones B and D for pMMP12 and with MCF-7 clones D and G for pPTX3. The lower part of the figure shows capillary morphogenesis at 6 hours with CM of MCF-7 clone G for pMMP12, and clone A for pPTX3. Similar results were obtained with other MCF-7 clones. Pictures show the results of a typical experiment of three experiments performed in triplicate. For quantification of capillary morphogenesis, refer to the legend of Figure 1. *P < .05, significantly different from control. (B) Same experiments as in panel A performed by using transfected MDA-MB-231 clones. Results of Matrigel invasion obtained with MDA-MB-231 clone H for pMMP12 and clone I for pPTX3 are shown. CM from the same clones was used in the capillary morphogenesis experiments shown in the lower part of the figure. All other MDA clones gave similar results. The numbers of experimental replicas were the same reported for panel A. Pictures show the results of a typical experiment of three experiments performed in triplicate. *P < .05, significantly different from control.
Figure 4
Figure 4
Activity on MVEC capillarymorphogenesis of transfected MDA clones in the presence or absence of FGF2. MVEC uPAR cleavage and angiostatin production. (A) MVEC capillary morphogenesis in the conditions reported in the legend of each picture. In the experiments shown in this panel, the MDA-MB-231 clones used were clone H for pMMP12 and clone E for pPTX3. Pictures show the results of a typical experiment of three experiments performed in triplicate bFGF, basic fibroblast growth factor. For quantification, refer to the legend of Figure 1. *P < .05, significantly different fromcontrol. Similar results were obtained withMCF-7 clones (not shown). (B) Western blot analysis of MVEC with uPAR anti-D1 mAb after incubating with CM from all the selected clones of pMMP12-transfected MDA-MB-231 breast carcinoma cells. α-Tubulin indicates loading control. Numbers on the right indicate molecular weights expressed in kilodaltons. MCF-7 clones gave similar results (not shown). (C) Western blot analysis of aliquots of pMMP12-transfected MDA-MB-231 clones medium incubated with standard plasminogen and probed with antiangiostatin mAb. Ten milliliters of CM from each clone was dialyzed against distilled water, lyophilized, and reconstituted in 200 µl of distilled water. Reconstituted samples were incubated overnight at 37°C with plasminogen (final concentration, 10 µg/ml). Aliquots containing 50 µg of proteins, showing similar Ponceau Red densitometric patterns, were applied to each lane. The figure shows the results of a typical experiment of three different experiments that gave similar results (not shown). MCF-7 clones gave similar results.
Figure 5
Figure 5
Matrigel sponge assay (in vivo angiogenesis). Angiogenesis in a Matrigel sponge assay by the addition of Matrigel containing heparin (50 U/ml) and aliquots of 50 µl of reconstituted CM, evaluated by hemoglobin (Hb) content. (A) Results obtained with MDA-321 CM. For PTX3, we used CM prepared from clone B (Figure 2A); for MMP12, we used CM prepared from clone I (Figure 2A); the mix was a CM composed of 50% clone B and 50% clone I. Graphs are shown as mean ± SE; ***P < .001 (Student's t test). At the bottom of each column, a representative photograph, taken at the stereomicroscope, of individual Matrigel sponges recovered at autopsy for the corresponding condition is shown. Clone I for PTX3 and clone H for MMP12 gave similar results (not shown). (B) Results obtained with MCF-7CM. For PTX3, we used CM prepared from clone A (Figure 2B); for MMP12, we used CM prepared from clone G (Figure 2B); the mix was a CM composed of 50% clone A and 50% clone G. Graphs are shown as mean ± SE; ***P < .001, *P < .05 (Student's t test). At the bottom of each column, a representative photograph, taken at the stereomicroscope, of individual Matrigel sponges recovered at autopsy for the corresponding condition is shown. Clone G for PTX3 and clone D for MMP12 gave similar results (not shown).
Figure 6
Figure 6
Tumor growth in vivo. Breast tumors were obtained by subcutaneous injection of 2.5 x 10⁶ MDA cells (A) and 4 x 10⁶ MCF-7 cells (B) mixed with liquid Matrigel (final volume, 300 µl) in the flanks of 6-week-old nude nu/nu (CD-1) BR mice. MDA and MCF-7 cells were transfected with different plasmid as shown. The 16 animals used for each cell line were treated as described in the Materials and Methods section. Briefly, four mice were injected with control pCDNA3+ cells (MDA or MCF-7), four mice with a pPTX3 clone (clone I for MDA and clone A for MCF-7), four mice with a pMMP12 clone (clone H for MDA and clone G for MCF-7), and four mice with a cell mix of both clones of MDA and MCF-7. Tumor growth was monitored at regular intervals by measuring two tumor diameters with calipers and calculating the tumor volumes with the following formula: length x width2 / 2. On day 23, the animals were killed, and the tumors were removed, weighed, and fixed in formalin. On the basis of image analysis of Azan-Mallory-stained tumor slices, the percent amount of cells over the whole mass recovered at autopsy (cell, Matrigel, and necrosis, when present) was calculated. Statistical analysis was therefore performed only for the cellular content (see the lower graphs of panels A and B). Graphs are shown as mean ± SE; ***P < .001, *P < .05 (Student's t test).
Figure 7
Figure 7
Histologic diagnosis of the tumors recovered at autopsy. Tumor slices were stained with hematoxylin-eosin and with Azan-Mallory stain. Owing to the intense differential dye affinity of breast cancer cells, Matrigel, and necrosis, it was possible to subject stained slices to image analysis by using a Leica DMR-DC200 light microscope equipped with Leica DC200 digital imaging system (Leica Camera AG) and to determine the percentage of tumor cells within the tumor mass obtained at autopsy. The figure shows the results obtained with MDA cells. MCF-7 cells provided similar images. Pictures shown were taken at a magnification of x40. Experimental conditions are reported on the left of each line of pictures. The inset in the upper right panel shows the staining affinity of a cell-free Matrigel mass recovered at autopsy.

Similar articles

Cited by

References

    1. Wittekind C, Neid M. Cancer invasion and metastasis. Oncology. 2005;69:14–16. - PubMed
    1. Carmeliet P, Collen D. Transgenic mouse models in angiogenesis and cardiovascular disease. J Pathol. 2000;190:387–405. - PubMed
    1. Ferrara N. VEGF: an update on biological and therapeutic aspects. Curr Opin Biotechnol. 2000;11:617–624. - PubMed
    1. Maxwell PH. The HIF pathway in cancer (2005) Semin Cell Dev Biol. 2005;16:523–530. - PubMed
    1. Cutolo M, Grassi W, Matucci-Cerinic M. Raynaud's phenomenon and the role of capillaroscopy. Arthritis Rheum. 2003;48:3023–3030. - PubMed

Publication types

MeSH terms

Substances

LinkOut - more resources