. 2010 Mar;88(4):712-21.
doi: 10.1002/jnr.22241.

Rapid assessment of internodal myelin integrity in central nervous system tissue

Affiliations

Rapid assessment of internodal myelin integrity in central nervous system tissue

Daniel A Kirschner et al. J Neurosci Res. 2010 Mar.

Abstract

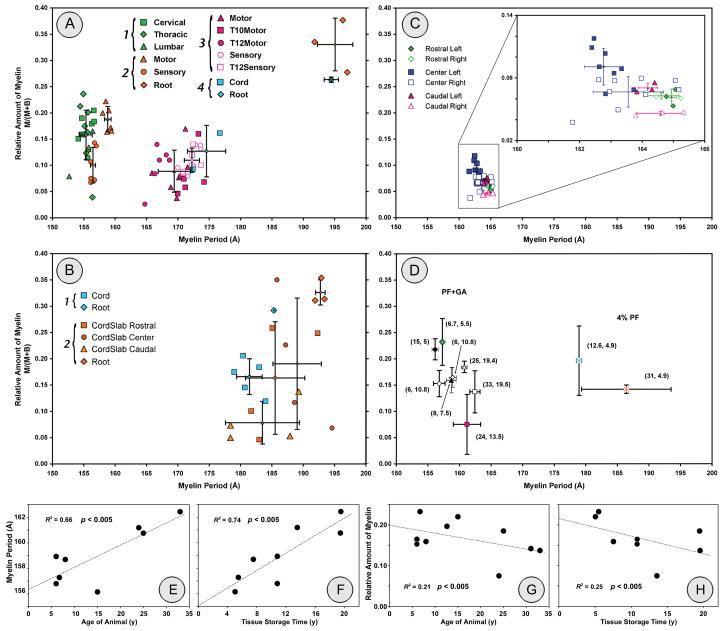
Monitoring pathology/regeneration in experimental models of de-/remyelination requires an accurate measure not only of functional changes but also of the amount of myelin. We tested whether X-ray diffraction (XRD), which measures periodicity in unfixed myelin, can assess the structural integrity of myelin in fixed tissue. From laboratories involved in spinal cord injury research and in studying the aging primate brain, we solicited "blind" samples and used an electronic detector to record rapidly the diffraction patterns (30 min each pattern) from them. We assessed myelin integrity by measuring its periodicity and relative amount. Fixation of tissue itself introduced +/-10% variation in periodicity and +/-40% variation in relative amount of myelin. For samples having the most native-like periods, the relative amounts of myelin detected allowed distinctions to be made between normal and demyelinating segments, between motor and sensory tracts within the spinal cord, and between aged and young primate CNS. Different periodicities also allowed distinctions to be made between samples from spinal cord and nerve roots and between well-fixed and poorly fixed samples. Our findings suggest that, in addition to evaluating the effectiveness of different fixatives, XRD could also be used as a robust and rapid technique for quantitating the relative amount of myelin among spinal cords and other CNS tissue samples from experimental models of de- and remyelination.


Figures

Figure 1
Figure 1
Examples of samples examined in this study. (Top) Samples (provided by Laboratory A) after inserting into x-ray capillaries, and maintained in contact with fixative. The piece of cord (2 mm capillary) is much thicker than the spinal nerve root (1 mm capillary). To appreciate how much of the specimen is “sampled” by the x-rays, consider that the beam is ~3 mm long (parallel to the long axis) × 200 μm wide. The right hand end of the root’s capillary is sealed with wax and nail polish. (Middle) Intact spinal cords (as received from Laboratory C) with their dorsal aspects facing the viewer (* dorsal horns). The heavy arrows show where we trimmed to avoid distortion damage from the pins holding the cords to the wax. The heavy brackets (and red marking) indicate the lesioned regions. The boxes indicate where we divided the cord into rostral, caudal, and lesioned segments before inserting left and right halves into x-ray capillaries. (Bottom) Cross-section of adult rat spinal cord (at T10) showing the motor pyramidal and extrapyramidal tracts, and sensory pathways of the dorsal columns.
Figure 2
Figure 2
XRD data (intensity shown as counts vs. channel number) recorded from aldehyde-fixed samples from four different laboratories (indicated by A–D). The spectra shown are representative patterns, corresponding to the mean values measured with respect to myelin period and to the relative amount of myelin (see below, Fig. 3). To more clearly distinguish among the spectra, the x-ray patterns have been shifted vertically relative to the lowest pattern within each panel. (A) Data from tissue batches 2 and 3 are illustrated. The nerve roots (upper spectrum)) show a very different pattern than the cords, with the intensity maxima at different channel positions. For batch 2, the patterns from the motor tracts are significantly stronger than from the sensory tracts (solid line vs. dashed line), indicating a greater relative amount of myelin. Another set of samples (batch 3), also fixed in 8% PF, did not replicate these findings owing to poorly preserved myelin, as indicated by the larger period, broader reflections, and weaker intensity. (B) Data from tissue batch 2 is shown. The rat tissue samples were fixed with 4% PF, and show similar periods for root and cord myelins: whereas the roots are similar in period to those from Laboratory A (~190 Å), the cords differ considerably in period between the two batches (see Fig. 3B). (C) Spinal cords from mice that had been lesioned on the right side with ethidium bromide (EB), and perfused with 2% GA after 10 d. The cords were subdivided as shown above (Fig. 1, bottom) and into left and right halves. We detected a greater relative amount of myelin in left (unlesioned) vs. right (lesioned) segments, as evident from the stronger patterns, particularly for the caudal, and somewhat for the lesioned (center) regions (Fig. 3C). The 2% GA fixative used here was not as effective in preserving myelin period as 8% PF; and the increased disordering of membranes obscured but did not prevent detecting a lower amount of myelin on the lesioned (right) side. (D) Of the four optic nerves shown here, two were from young animals, and two from old; and two had been fixed with PF + GA (2% PF + 2.5% GA) and two with 4% PF. Both “young” nerves had stronger myelin diffraction than the corresponding “old” ones that had been fixed similarly; and the myelin periods from the (PF+GA)-fixed nerves were more native-like than those in 4% PF.
Figure 3
Figure 3
Scatter plots of the relative amount of myelin (M/M+B) vs. myelin period (d) for all of the samples received from the four different laboratories (A–D). Representative x-ray spectra are shown in Fig. 1. (A) Data from the different batches of samples tend to cluster, indicating internal consistency within each batch, but variation batch-to-batch, even for samples stabilized with the same fixative (batches 1–3). Data from motor vs. sensory tracts (batch 2), dissected from cords as indicated in Fig. 1 (bottom), are distinguished from one another. The data in the upper right hand corner are from spinal roots, and are clearly separated from the cord data. (B) Whereas the cord (■) and root (◆) data for batch 1 are differentiated from one another, the data from the vibratome slabs (■,,▲) (batch 2) had so much scatter that some of the measurements overlapped with the root data (◆). The myelin periodicity is substantially larger than those measured for the samples from laboratory A. (C) Comparison of right vs. left segments reveals a noticeable reduction in the relative amount of myelin (see Inset on expanded scale) in regions caudal to (△ vs. ▲) and near to (□ vs. ■) the lesion on the right-hand side but not on the left hand, non-lesioned side. The period in these 2% GA-fixed nerves, and hence the myelin preservation, can likely be improved by using PF+GA. (D) Summary of data for both optic nerve and corpus callosum samples from non-human primate. The samples show substantially better myelin preservation with PF+GA fixative than with 4% PF (closed and open symbols vs. crosses) with respect to period but not necessarily with respect to the relative amount of myelin. The values in parentheses at each data point indicate the age (in years) of the animal when sacrificed and the time (in years) of storage of the tissue. Because samples had been stored in fixative for times ranging from 5–20 years, we examined correlations between myelin period and relative amount of myelin vs. age of animal and tissue storage time (E–H). Whereas period increased with age of animal and with tissue storage time, the relative amount of myelin decreased with age and with storage. For each of these linear correlations, p<0.005 (see text for details).

Similar articles

Cited by

References

    1. Agrawal D, Hawk R, Avila RL, Inouye H, Kirschner DA. Internodal myelination during development quantitated using x-ray diffraction. J Struct Biol. 2009 accepted. - PubMed
    1. Akiyama Y, Radtke C, Kocsis JD. Remyelination of the rat spinal cord by transplantation of identified bone marrow stromal cells. J Neurosci. 2002;22(15):6623–6630. - PMC - PubMed
    1. Avila RL. Ph.D. Dissertation. Chestnut Hill, MA: Boston College; 2007. Analysis of Internodal Myelin Structure in Transgenic Mice and Zebrafish Using X-Ray Diffraction; p. 286.
    1. Avila RL, Inouye H, Baek R, Yin X, Trapp BD, Feltri ML, Wrabetz L, Kirschner DA. Structure and stability of internodal myelin in mouse models of hereditary neuropathy. J Neuropathol Exp Neurol. 2005;64:976–990. - PubMed
    1. Blakemore WF, Crang AJ. The relationship between type-1 astrocytes, Schwann cells and oligodendrocytes following transplantation of glial cell cultures into demyelinating lesions in the adult rat spinal cord. J Neurocytol. 1989;18(4):519–528. - PubMed

Publication types