. 2010 Feb 15;88(3):589-604.
doi: 10.1002/jnr.22236.

Interaction of Rab31 and OCRL-1 in oligodendrocytes: its role in transport of mannose 6-phosphate receptors

Affiliations

Interaction of Rab31 and OCRL-1 in oligodendrocytes: its role in transport of mannose 6-phosphate receptors

A G Rodriguez-Gabin et al. J Neurosci Res. .

Abstract

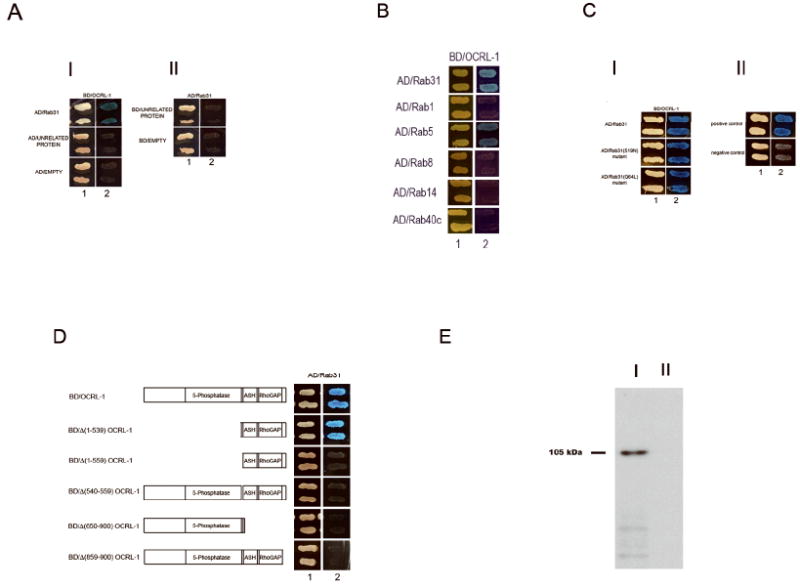
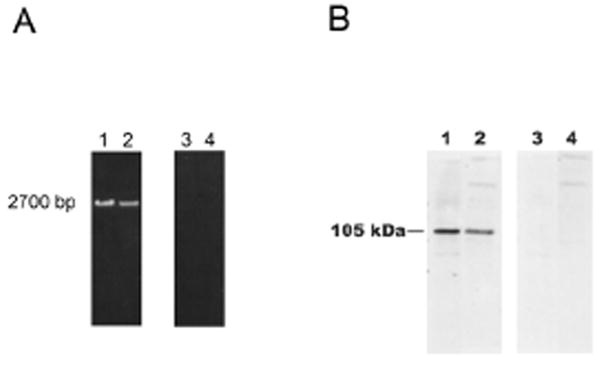
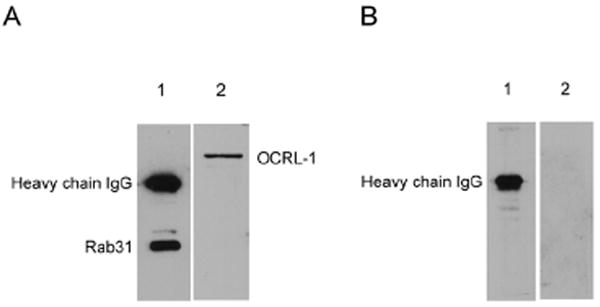
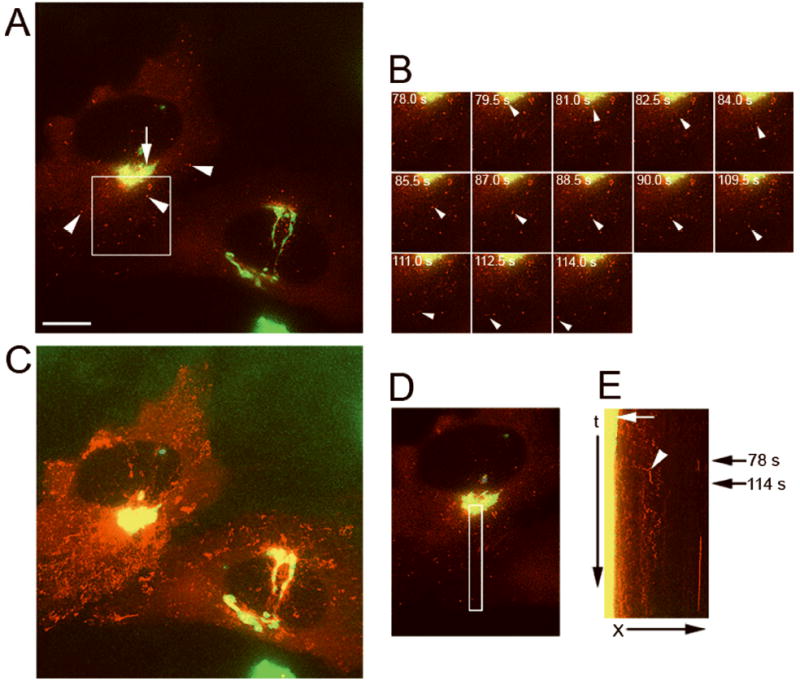
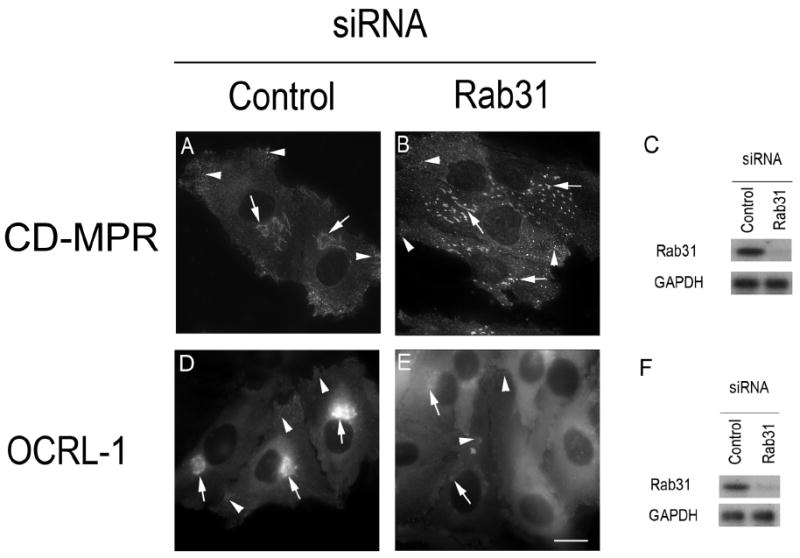
Rab31, a protein that we cloned from an oligodendrocyte cDNA library, is required for transport of mannose 6-phosphate receptors (MPRs) from the trans-Golgi network (TGN) to endosomes and for Golgi/TGN organization. Here we extend the knowledge of the mechanism of action of Rab31 by demonstrating its interaction with OCRL-1, a phosphatidylinositol 4,5-diphosphate 5-phosphatase (PI(4,5)P(2) 5-phosphatase) that regulates the levels of PI(4,5)P(2) and PI(4)P, molecules involved in transport and Golgi/TGN organization. We show that Rab31 interacts with OCRL-1 in a yeast two-hybrid system, GST-Rab31 pull-down experiments, and coimmunoprecipitation of OCRL-1 using oligodendrocyte culture lysates. Rab31 and OCRL-1 colocalize in the TGN, post-TGN carriers, and endosomes. Cation-dependent MPR (CD-MPR) is sorted to OCRL-1-containing carriers, but CD63 and vesicular stomatitis virus G (VSVG) are not. siRNA-mediated depletion of endogenous Rab31 causes collapse of the TGN apparatus and markedly decreases the levels of OCRL-1 in the TGN and endosomes. Our observations indicate that the role of Rab31 in the Golgi/TGN structure and transport of MPRs depends on its capability to recruit OCRL-1 to domains of the TGN where the formation of carriers occurs. The importance of our observations is highlighted by the fact that mutation of OCRL-1 causes demyelination in humans.


Figures

Figure 1
Figure 1
A) Rab31 interacts with OCRL-1. (I) Y187 yeast strain transformed with the BD/OCRL-1 plasmid was mated with the AH109 yeast strain transformed with the following plasmid: a) AD/Rab31, b) AD/unrelated protein, c) AD/empty. (II) Y187 strain transformed with AD/Rab31 was mated with the AH109 strain transformed with following plasmid: d) BD/unrelated protein and e) BD/empty plasmid. The mating mixtures were first plated on agar containing double drop out (DO) media (1), to assess for mating efficiency. Then, a replica plate onto agar containing quadrate drop out media (QO, high stringency media) was made (2), to identify the diploids expressing fusion proteins that interact. Additionally, the expression of the lacZ gene was assessed; X-α-gal was used as α-galactosidase substrate (interaction results in growth of blue colonies). B) Interaction of OCRL-1 with Rab proteins. The capacity of OCRL-1 to interact with other Rab proteins was assessed using the yeast two hybrid system. The AH109 yeast strain transformed with BD/OCRL-1 plasmid was mated with the Y187 yeast strain transformed with the following plasmid: a) AD/rRab22b, b) AD/ Rab1, c) AD/Rab5, d)AD/Rab8, e) AD/Rab14 and f) AD/Rab40c g) positive control and h) negative control. C) Formation of OCRL-1-Rab31 complex does not depend on the conformational state of Rab31. (I) The AH109 yeast strain transformed with BD/OCRL-1 plasmid was mated with the Y187 yeast strain transformed with the following plasmid: a) AD/Rab31, b) AD/ Rab31(S19N), c) AD/Rab31(Q64L). (II) Positive control and negative control. Positive experimental controls were carried out by mating AH109 host strain transfected with pGBKT7-53 and Y187 transfected with pGADT7-T. pGBKT7-53 encode fusions between the GAL4 DNA-BD and murine p53, while pGBKT7-T -encode fusions between AD and SV40 large T-antigen. Negative experimental controls were carried out by mating AH109 host strain transfected with pGBKT7-Lam with Y187 transfected with pGADT7-T. pGBKT7-Lam encode a fusion of the DNA-BD with human lamin C. D) Mapping of the Rab31 binding site in OCRL-1. Full-length and truncated OCRL-1 constructs were tested for interaction with Rab31 using the yeast two-hybrid system. The Y187 yeast strain transformed with AD/Rab31 plasmid was mated with the AH109 yeast strain transformed with the following plasmids: a) BD/OCRL-1, b) BD/Δ (1-539) OCRL-1, c) BD/Δ(1-559) OCRL-1, d) BD/Δ(540-559) OCRL-1, e) BD/Δ (650-900) OCRL-1 and f) BD/Δ (858-900) OCRL-1. E) GST-Rab31 pull-down experiments. [35S]-labeled OCRL-1 protein was incubated in a media containing 100 μM GTP with either GST-Rab31 (I) or GST (II). The GST-Rab31-OCRL-1 complex was pulled down with agarose-glutathione beads. The proteins were separated by SDS-PAGE. The band containing the [35S]-labeled protein was revealed using a fluographic reagent and exposing the gel overnight to X-ray film. Number to the left indicates the molecular weight of [35S]-labeled OCRL-1 protein.
Figure 2
Figure 2. OCRL-1 is expressed in oligodendrocytes and HOG cells
A) RT-PCR analysis of the expression of OCRL-1 in rat oligodendrocytes and HOG cells. RT reaction was performed using 10 μg of total RNA and primers targeting the C terminus of OCRL-1 (rat and human). PCR reactions were carried out using the cDNA obtained in the RT reaction and primers targeting the C- and the N- termini (lanes 1 and 2). To rule out DNA contamination, PCR was carried out using as templates total RNA (lane 3 and 4). PCR products were separated by electrophoresis on 1 % agarose gels. Oligodendrocytes, lanes 1 and 3; HOG cells, lanes 2 and 4. B) Western blot analysis of OCRL-1 expression in differentiated oligodendrocyte cultures and HOG cells with monoclonal antibody against OCRL-1. Lysate samples containing 20 μg of protein (Oligodendrocytes, lanes 1 and 3; HOG cells, lanes 2 and 4) were resolved by SDS-PAGE on 6 % gels. Proteins were transferred to nitrocellulose membranes by electroblotting. Nitrocellulose membranes were overlaid with media containing monoclonal antibody against OCRL-1 (lanes 1 and 2). Negative control consisted in membranes incubated in the absence of antibody against OCRL-1 (lanes 3 and 4). Bound antibodies were detected by enhanced chemiluminescence.
Figure 3
Figure 3. Coimmunoprecipitation of Rab31 and OCRL-1
A) Immune complexes formed by treatment of oligodendrocyte lysates with rabbit IgG against Rab31. B) Immune complexes formed by treatment of the lysates with non specific rabbit IgG. Samples were resolved by SDS-PAGE on 10 % gels. Proteins were transferred from gel to nitrocellulose membranes by electroblotting. Nitrocellulose membranes were overlaid with media: containing rabbit IgG against Rab31 (lane 1) or mouse monoclonal anti- OCRL-1 (lane 2). Bound antibodies were detected by enhanced chemiluminescence using goat anti-rabbit antibodies (lane 1) or rabbit antimouse antibodies (lane 2) conjugated to horseradish peroxidase.
Figure 4
Figure 4. OCRL-1 localizes at the Golgi/TGN and in carriers budding from the TGN
HeLa cells expressing both pGolgi-ECFP and OCRL-1-EYFP were analyzed by fluorescence microscopy. Images at two different emission wavelengths (465 ± 30 nm and 535 ± 30 nm) from the same field were collected every 2 s. to simultaneously visualize pGolgi-ECFP and OCRL-1-EYFP. A) Fluorescence distribution pattern. Red, OCRL-1-EYFP; green, pGolgi-ECFP; yellow, overlapping of OCRL-1-EYFP and pGolgi-ECFP. The arrow shows the colocalization of OCRL-1-EYFP and pGolgi at the Golgi/TGN, arrowheads point to small vesicles present throughout the cytoplasm containing only OCRL-1-EYFP. B) Individual frames of the area boxed in (A). A carrier containing OCRL-1-EYFP breaks up from the TGN and moves towards the cell periphery (white arrowheads). The time in seconds relative to the first image is shown in each frame. C) Maximum pixel projection. OCRL-1-EYFP and pGolgi-ECFP co-localized in the TGN but not in small vesicles present throughout the cytoplasm. D) Area where the events in B (carrier formation and movement to cell periphery) occurred is indicated by a white box. E) Kymograph analysis of the area defined in (D). A lack of movement of TGN compartments results in a vertical trace (yellow, white arrow). Several carriers containing OCRL-1-EYFP are formed in the TGN (red diagonal traces beginning in the yellow vertical trace). The trace that corresponds to carrier budding in (B) is indicated (white arrowhead). Black arrows on the right indicate the time when budding in (B) occurred. X, distance in μm; t, time in seconds. Bar, 10 μm.
Figure 5
Figure 5. Rab31 and OCRL-1 colocalize in carriers that bud from the TGN
Stably-transfected HeLa cells expressing OCRL-1-ECFP were transiently-transfected with a plasmid encoding Rab31-EYFP. Cells were transferred to recording medium. Formation and the transport of post-TGN carriers were monitored at 32° C by time-lapse fluorescence microscopy, images were collected every 1 s. A) Fluorescence pattern distribution. OCRL-1-ECFP (red), Rab31-EYFP (green) and overlapping of OCRL-1-ECFP and Rab31-EYFP (yellow). Rab31-EYFP and OCRL-1-ECFP co-localize in the TGN (arrow), and in endosomes throughout the cytoplasm (arrowheads). B) Individual frames showing a carrier containing both OCRL-1-ECFP and Rab31-EYFP breaking up from the TGN (white arrowheads). Time in seconds relative to the first image is shown in each frame. C) Maximum pixel projection. OCRL-1-ECFP and Rab31-EYFP co-localized at the TGN and in small vesicles present throughout the cytoplasm. D) Area where the events in B (carrier formation and movement to cell periphery) occurred is indicated by a white lane. E) Kymograph analysis of the area defined in (D). The TGN compartments, vertical yellow trace, is indicated with a white arrow. The carrier formation and its movement, diagonal yellow trace is indicated by the arrowhead. White arrowhead identifies the trace that corresponds to carrier budding shown in (B). Black arrows at the right indicate the time of budding shown in (B). X, distance in μm; t, time in seconds. Bar, 10 μm.
Figure 6
Figure 6. OCRL-1 carriers transport CD-MPR from TGN to endosomes
HeLa cells expressing CD-MPR-ECFP and OCRL-1-EYFP were analyzed by fluorescence microscopy. The formation and the transport of post-Golgi carriers were monitored by time-lapse fluorescence microscopy at 32° C. CD-MPR-ECFP and OCRL-1-EYFP were simultaneously visualized, images were collected every 1 s. A) Fluorescence pattern distribution; CD-MPR-ECFP (red), OCRL-1-EYFP (green) and overlapping of CD-MPR-ECFP and OCRL-1-EYFP (yellow). OCRL-1-ECFP and CD-MPR-ECFP colocalized at the TGN (arrow), and in endosomes present throughout the cytoplasm (arrowheads). B) Individual frames showing a TGN tubule that extends (white arrows), and breaks up to form a carrier containing both CD-MPR-ECFP and Rab31-EYFP (white arrowheads). Top panels: merged images; center panels: CD-MPR-ECFP; lower panels: OCRL-1-EYFP. Time relative to the first image is shown in seconds. C) Area where the events showed in B (carrier formation and movement to cell periphery) occurred is indicated by a white line. D) Kymograph analysis of the area defined in (C). A lack of movement of the TGN compartments results in a vertical trace (white arrow). Carrier formation and its movement along the area results in a diagonal trace that begins in the vertical trace (white arrowhead). Arrows at the right indicate the time where the budding showed in (B) occurred. E) Maximum pixel projection. OCRL-1-EYFP and CD-MPR-ECFP co-localized at the TGN and in small vesicles present throughout the cytoplasm X, distance in μm; t, time in seconds. (See animated movie Figure 6). Bar, 10 μm.
Figure 7
Figure 7. OCRL-1 and newly synthesized CD63 are sorted to different carriers budding from the TGN
Stably-transfected Hela cells expressing OCRL-1-ECFP were injected intranuclearly with cDNAs encoding CD63-EYFP. Newly synthesized CD63-EYFP was trapped in the TGN and carrier formation visualized by time-lapse double fluorescence microscopy at 32° C. A) Fluorescence distribution pattern. Green, CD63-EYFP; red, OCRL-1-ECFP; yellow overlapping of CD63-EYFP and OCRL-1-ECFP. CD63-EYFP and OCRL-1-ECFP partially co-localized in the Golgi/TGN (arrow), but not in small vesicles present through out the cytoplasm (arrowheads). B) Individual frames of the area marked with green box in (A). Top panels: overlap of images; central panels: OCRL-1-ECFP; lower panel: CD63-EYFP. A TGN tubule containing CD63-EYFP extends (white arrows), and breaks up to form a carrier (white arrowheads). The time relative to the first image is shown in seconds. C) Area where the events showed in B occurred (carrier formation and their movement to cell periphery) is indicated by a white lane. D) Kymograph analysis of the area defined in (C). TGN, vertical traces (red and green lines, white arrow). The green trace that corresponds to the budding of carrier containing CD63-EYFP showed in (B) is indicated by a white arrow head. Black arrows on the right indicate the time where the budding showed in (B) occurred. E) Individual frames of the area marked with red box in (A). A TGN tubule containing CD63-EYFP extend (white arrow), and breaks up to form a carrier (white arrowheads). The time relative to the first image is shown in seconds. F) Area where the events showed in E occurred (carrier formation and its movement to cell periphery) is indicated by a white line. G) Kymograph analysis of the area defined in (F). The green line that corresponds to the TGN compartment from which the carrier was formed is indicated by a white arrow. The green trace that corresponds to the budding of carrier containing CD63-EYFP shown in (E) is indicated by a white arrowhead. Black arrows on the right indicate the time where the budding shown occurred. H) Maximum pixel projection. OCRL-1-EYFP and CD-MPR-ECFP co-localized in the TGN, but not in small vesicles present throughout the cytoplasm. X, distance in μm; t, time in sec. Bar, 10 μm.
Figure 8
Figure 8. OCRL-1 and newly synthesized VSVG are sorted to different carriers budding from the TGN
Stably-transfected HeLa cells expressing OCRL-1-ECFP were transfected with plasmid encoding VSVG-Venus, and then incubated at 40° C for 10-12 h to accumulate VSVG-Venus in the ER. Transfected cells were then incubated at 20° C for 3 h, with cycloheximide (100 μg/ml) to trap VSVG-Venus at the TGN. The cells were transferred to recording media at 32 ° C to induce transport of VSVG from Golgi to PM. Time-lapse photographs visualized the formation of carriers containing OCRL-1-ECFP and of carriers containing VSVG-Venus. Images were collected every 1.70 s. A) Fluorescence distribution pattern. Green, VSVG-Venus; red, OCRL-1-ECFP and yellow, overlapping of VSVG-Venus and OCRL-1-ECFP. OCRL-1-ECFP and VSVG-Venus co-localized at the TGN (yellow arrow). Small vesicles present in the cytoplasm only contain VSVG-Venus (green arrowheads) or OCRL-1-ECFP (red arrowheads). B) Top panels, individual frames of the area marked with red box in (A). A TGN tubule containing OCRL-1-ECFP extends (arrow), and breaks up to form a carrier (arrowheads). Bottom panels, individual frames of the area marked with green box in (A). A TGN tubule containing VSVG-Venus extends (arrow), and breaks up to form a carrier (arrowheads). C) Area where the events in B occurred (top panels) is indicated by a white line. D) Kymograph analysis of the area defined in (C). TGN compartments, vertical traces (white arrow). The red trace that corresponds to the budding of carrier containing OCRL-1-ECFP seen in (B) is indicated by a white arrowhead. Arrows at the right indicate the time of budding in (B). E) Area where the events in B occurred (bottom panels) is indicated by a white line. F) Kymograph analysis of the area defined in (E). TGN compartments, vertical traces (white arrow). The green trace that corresponds to the budding of carrier containing VSVG-Venus seen in (B) is indicated by a white arrowhead. Arrows on the right indicate the time of budding in (B). X, distance in μm; t, time in seconds. G) Maximum pixel projection. OCRL-1-ECFP and VSVG-Venus colocalized in the TGN but not in small vesicles present throughout the cytoplasm. Bar, 10 μm.
Figure 9
Figure 9. Depletion of endogenous Rab31 results in Golgi/TGN fragmentation
(A and D) HeLa cells were transfected with non targeting siRNA (control), or (B and E) with siRNA targeting a segment of the sequence of Rab31 present in exon 2 ( 5 ’-GGAUCACUUUGACCACCACAAC-3’). After 48 h, the level of Rab31 and GAPDH were determined by immunoblotting (C and F). The effect of Rab31 depletion on the distribution of CD-MPR-ECFP (B) or OCRL-1-ECFP (E) were analyzed by fluorescence microscopy. Arrows indicate the position of Golgi/TGN, while arrowheads indicate the position of small tubular vesicles likely to represent endosomes. Bar, 10 μm.

Similar articles

Cited by

References

    1. Allan BB, Moyer BD, Balch WE. Rab1 recruitment of p115 into a cis-SNARE complex: programming budding COPII vesicles for fusion. Science. 2000;289:444–448. see comments. - PubMed
    1. Armstrong J. How do Rab proteins function in membrane traffic? Int J Biochem Cell Biol. 2000;32:303–307. - PubMed
    1. Blewitt ME, Gendrel AV, Pang Z, Sparrow DB, Whitelaw N, Craig JM, Apedaile A, Hilton DJ, Dunwoodie SL, Brockdorff N, Kay GF, Whitelaw E. SmcHD1, containing a structural-maintenance-of-chromosomes hinge domain, has a critical role in X inactivation. Nat Genet. 2008;40:663–669. - PubMed
    1. Bonifacino JS, Glick BS. The mechanisms of vesicle budding and fusion. Cell. 2004;116:153–166. - PubMed
    1. Bonifacino JS, Traub LM. Signals for sorting of transmembrane proteins to endosomes and lysosomes. Annu Rev Biochem. 2003;72:395–447. - PubMed

Publication types

MeSH terms