Review
. 2009;92(6):573-95.
doi: 10.1002/bip.21316.

Intrinsic amino acid side-chain hydrophilicity/hydrophobicity coefficients determined by reversed-phase high-performance liquid chromatography of model peptides: comparison with other hydrophilicity/hydrophobicity scales

Affiliations
Review

Intrinsic amino acid side-chain hydrophilicity/hydrophobicity coefficients determined by reversed-phase high-performance liquid chromatography of model peptides: comparison with other hydrophilicity/hydrophobicity scales

Colin T Mant et al. Biopolymers. 2009.

Abstract

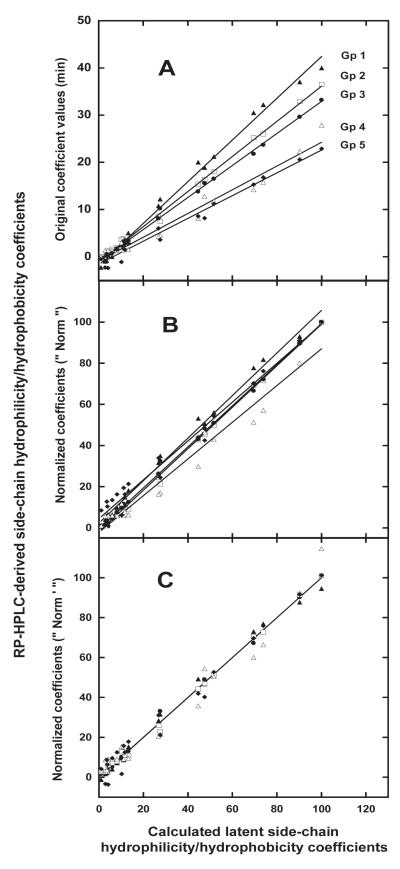
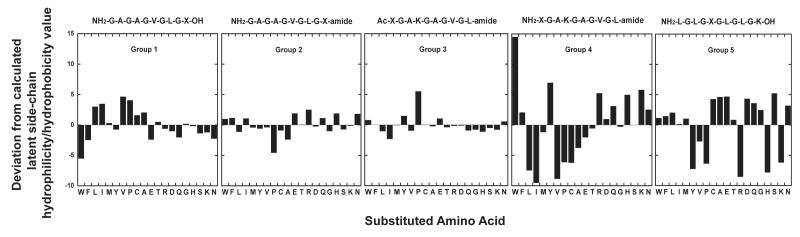
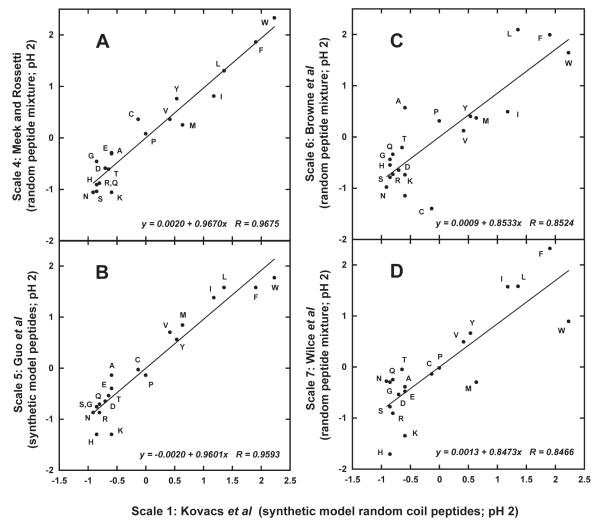
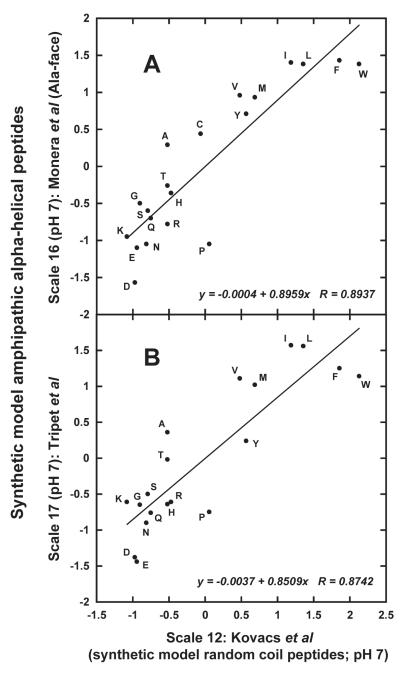
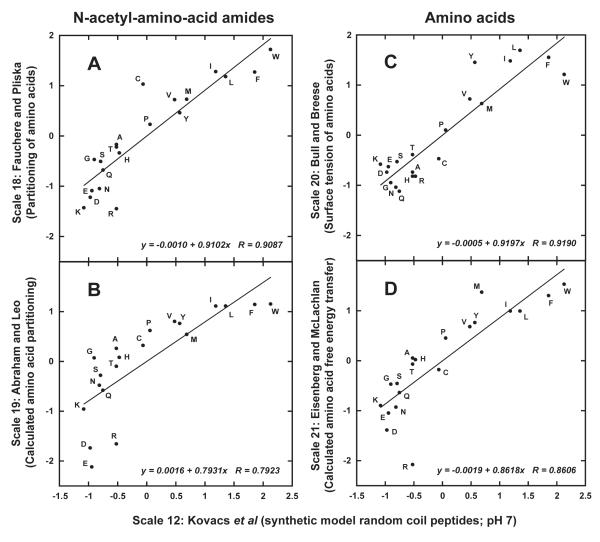
An accurate determination of the intrinsic hydrophilicity/hydrophobicity of amino acid side-chains in peptides and proteins is fundamental in understanding many area of research, including protein folding and stability, peptide and protein function, protein-protein interactions and peptide/protein oligomerization, as well as the design of protocols for purification and characterization of peptides and proteins. Our definition of intrinsic hydrophilicity/hydrophobicity of side-chains is the maximum possible hydrophilicity/hydrophobicity of side-chains in the absence of any nearest-neighbor effects and/or any conformational effects of the polypeptide chain that prevent full expression of side-chain hydrophilicity/hydrophobicity. In this review, we have compared an experimentally derived intrinsic side-chain hydrophilicity/hydrophobicity scale generated from RP-HPLC retention behavior of de novo designed synthetic model peptides at pH 2 and pH 7 with other RP-HPLC-derived scales, as well as scales generated from classic experimental and calculation-based methods of octanol/water partitioning of Nalpha-acetyl-amino-acid amides or free energy of transfer of free amino acids. Generally poor correlation was found with previous RP-HPLC-derived scales, likely due to the random nature of the peptide mixtures in terms of varying peptide size, conformation and frequency of particular amino acids. In addition, generally poor correlation with the classical approaches served to underline the importance of the presence of a polypeptide backbone when generating intrinsic values. We have shown that the intrinsic scale determined here is in full agreement with the structural characteristics of amino acid side-chains.


Figures

FIGURE 1
FIGURE 1
A: Relationship between RP-HPLC-derived amino acid hydrophilicity/hydrophobicity coefficients and calculated latent coefficients. B: Relationship between normalized (“ Norm ”) RP-HPLC-derived coefficients and calculated latent coefficients. C: Relationship between normalized (“ Norm ’ “) RP-HPLC-derived coefficients and calculated latent coefficients; the original normalized coefficients (Norm; Figure1B) have been adjusted to produce a best-fit plot whereby the slope is 1.0 and the intercept is zero for all five peptide groups. Data taken from Table II; peptide sequences shown in Table I.
FIGURE 2
FIGURE 2
Deviation (Δ values in Table II) normalized amino acid hydrophilicity/hydrophobicity coefficients (Norm ’ in Table II) from calculated latent coefficients (Table II) for five peptide groups.
FIGURE 3
FIGURE 3
Helical net representations of model α-helical synthetic peptides used to determine hydrophilicity/hydrophobicity scales. Top left: sequence used in Scales 9 (Sereda et al; “Ala-face”) and 16 (Monera et al 24). Top right: sequence used in Scale 10 (Sereda et al; “Leu-face”). Bottom left: sequence of a non-amphipathic α-helix used in Scale 11 (Liu and Deber 25). Bottom right: sequence used in Scale 17 (Tripet et al 26). Dashed line enclosures represent the hydrophobic faces of amphipathic α-helical model peptides: the faces of the top two helices represent “wide” hydrophobic faces, whilst the helix shown at bottom right exhibits a “narrow” hydrophobic face where the helices form coiled-coils. Sites denoted with an “X” are the substitution sites; arrows denote possible interactions of adjacent residues with the substitution site(s), as discussed in the text.
FIGURE 4
FIGURE 4
Plot of normalized RP-HPLC-derived amino acid hydrophilicity/hydrophobicity Scales 4 (A; random peptide mixture), 5 (B; synthetic model random coil peptides), 6 (C; random peptide mixture) and 7 (D; random peptide mixture), all at pH 2, versus Scale 1 (synthetic model random coil peptides) at pH 2. Normalized data taken from Table V. Descriptions of how scales were generated shown in footnotes to Table III.
FIGURE 5
FIGURE 5
Plot of normalized RP-HPLC-derived amino acid hydrophilicity/hydrophobicity Scales 13 (A; synthetic model random coil peptides), 15 (B; synthetic model random coil peptides) and 14 (C; random peptide mixture), all at pH 7, versus Scale 12 (synthetic model random coil peptides) at pH 7. Normalized data taken from Table V. Descriptions of how scales were generated shown in footnotes to Table III.
FIGURE 6
FIGURE 6
Plot of normalized RP-HPLC-derived amino acid hydrophilicity/hydrophobicity Scales 12 (A; synthetic model random coil peptides) and 13 (B; synthetic model random coil peptides), both at pH 7, versus Scale 2 (synthetic model random coil peptides) at pH 2. Normalized data taken from Table V. Descriptions of how scales were generated shown in footnotes to Table III.
FIGURE 7
FIGURE 7
Plot of normalized amino acid hydrophilicity/hydrophobicity Scales 9 (A; synthetic model α-helical peptides; Sereda et al, “Ala-face” 22), 10 (B; synthetic model α-helical peptides; Sereda et al, “Leu-face” 22) and 11 (C; synthetic model α-helical peptides; Liu and Deber 24), all at pH 2, versus Scale 1 (synthetic model random coil peptides; Kovacs et al 4) at pH 2. Normalized data taken from Table V. Descriptions of how scales were generated shown in footnotes to Table III. Helical net representations shown in Figure 3.
FIGURE 8
FIGURE 8
Plot of normalized amino acid hydrophilicity/hydrophobicity Scales 16 (A; synthetic model α-helical peptides; Monera et al, “Ala-face” 24) and 17 (B; synthetic model α-helical peptides; Tripet et al 26), both at pH 7, versus Scale 12 (synthetic model random coil peptides; Kovacs et al 4) at pH 7. Normalized data taken from Table V. Descriptions of how scales were generated shown in footnotes to Table III.
FIGURE 9
FIGURE 9
Plot of normalized amino acid hydrophilicity/hydrophobicity Scale 11 at pH 2 (A; synthetic model α-helical peptides; Liu and Deber 25) and Scale 16 (synthetic model α-helical peptides; Monera et al, “Ala-face” 24) at pH 7 (B) versus Scale 9 (synthetic model α-helical peptides) at pH 2; Scale 17 (synthetic model α-helical peptides; Tripet et al 26) at pH 7 (C) versus Scale 16 (synthetic model α-helical peptides; Monera et al, “Ala-face” 24) at pH 7. Normalized data taken from Table V. Descriptions of how scales were generated shown in footnotes to Table III. Helical net representations shown in Figure 3.
FIGURE 10
FIGURE 10
Plot of normalized amino acid hydrophilicity/hydrophobicity Scales 18 (A; experimental water/octanol partitioning of Nα-acetyl-amino-acid amides), 19 (B; calculated partitioning of Nα-acetyl-amino-acid amides), 20 (C; experimental free energies of transfer of amino acids) and 21 (D; calculated free energies of transfer of amino acids) versus Scale 12 (synthetic model random coil peptides Kovacs et al 4) at pH 7. Normalized data taken from Table V. Descriptions of how scales were generated shown in Table III.
FIGURE 11
FIGURE 11
Computational model used in the Brugs program. The formatting of this model is according to Brugs conventions.
FIGURE 12
FIGURE 12
Autocorrelation of parameters in chain one. Autocorrelation of five alpha (intercept, A), five beta (slope B) and X (free amino acid specific mean, C) are shown.

Similar articles

Cited by

References

    1. Palliser CC, Parry DAD. Proteins: Struc Func Genet. 2001;42:243–255. - PubMed
    1. Biswas KM, DeVido DR, Dorsey JG. J Chromatogr A. 2003;1000:637–655. - PubMed
    1. Baczek T, Kaliszan R. Proteomics. 2009;9:835–847. - PubMed
    1. Kovacs JM, Mant CT, Hodges RS. Biopolymers (Peptide Sci) 2005;84:283–297. - PMC - PubMed
    1. Tripet B, Cepeniene D, Kovacs JM, Mant CT, Krokhin OV, Hodges RS. J Chromatogr A. 2007;1141:212–225. - PMC - PubMed

MeSH terms

LinkOut - more resources