. 2010 May 1;126(9):2112-22.
doi: 10.1002/ijc.24909.

Increased local dopamine secretion has growth-promoting effects in cholangiocarcinoma

Affiliations

Increased local dopamine secretion has growth-promoting effects in cholangiocarcinoma

Monique Coufal et al. Int J Cancer. .

Abstract

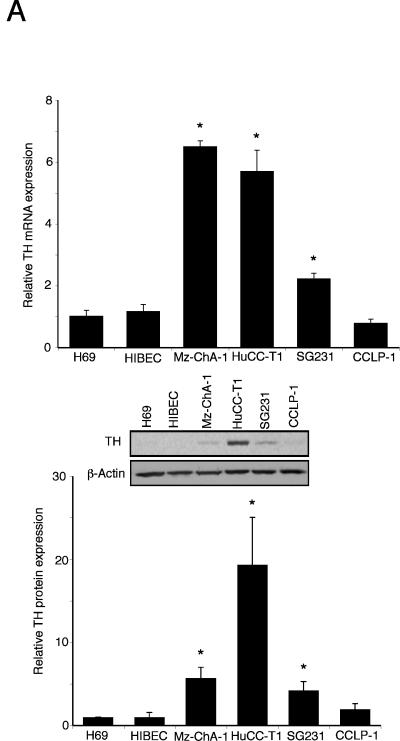
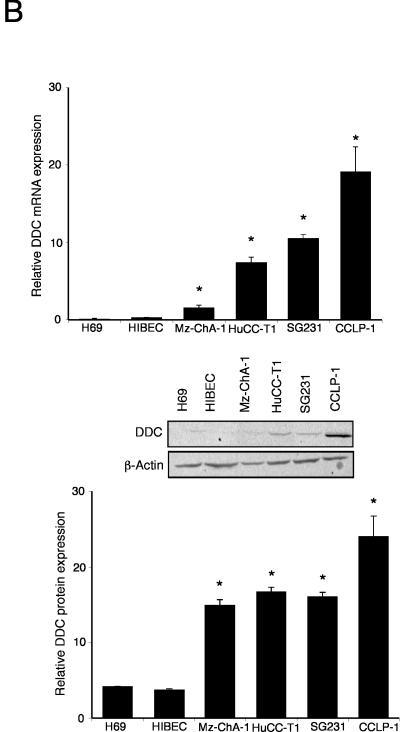
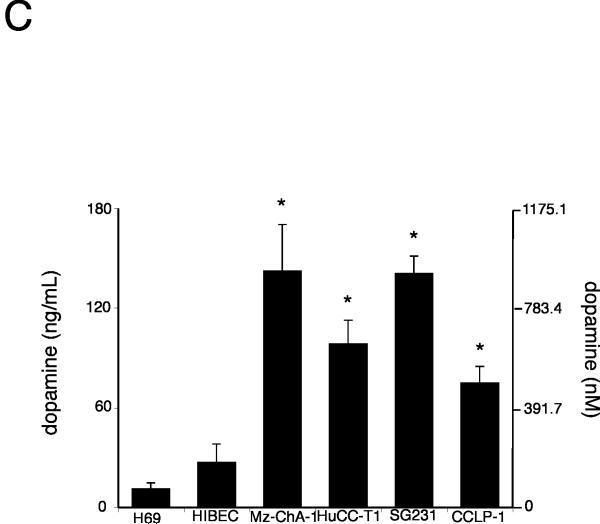
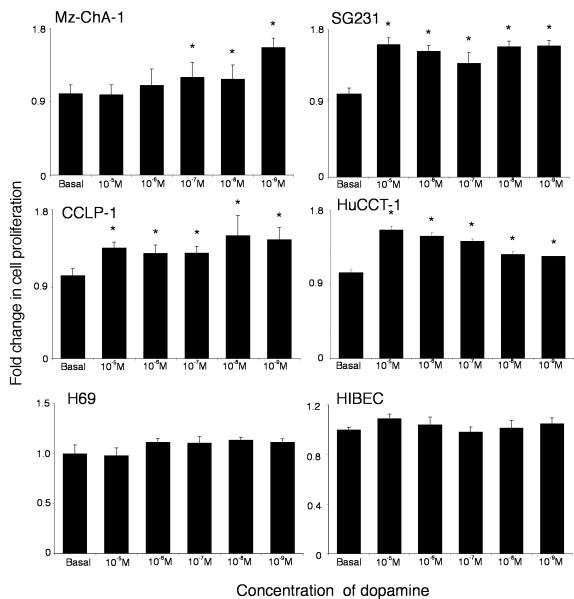
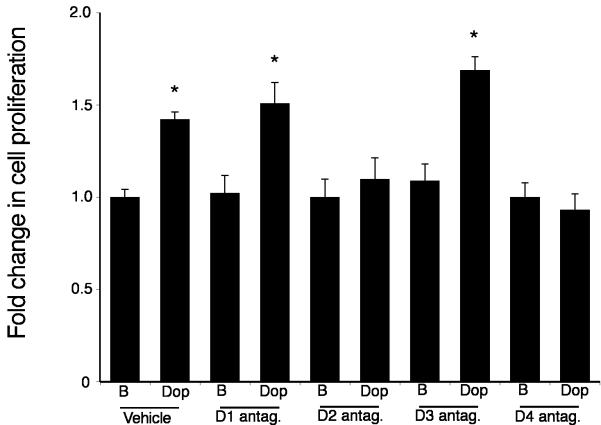
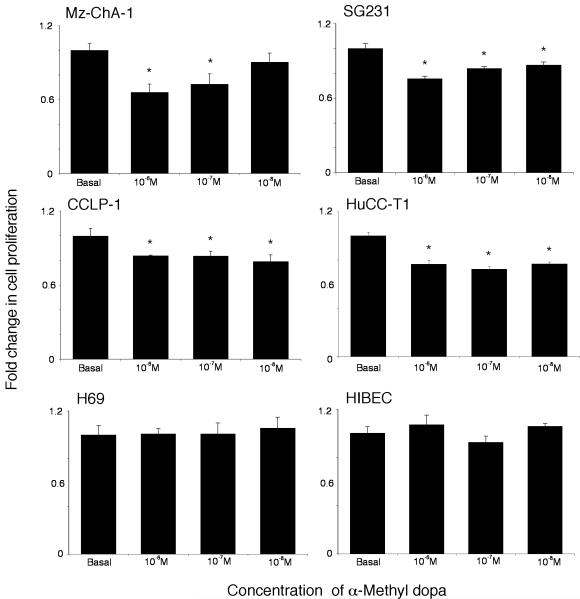
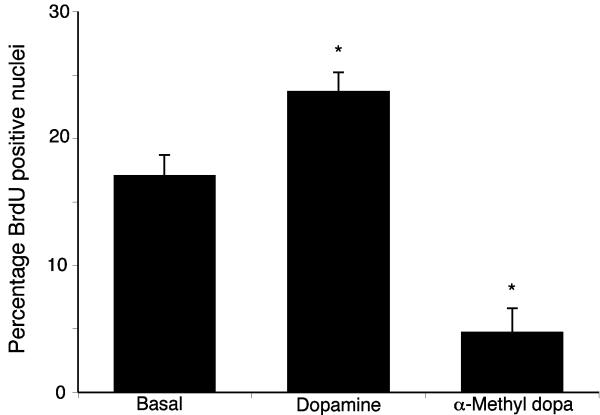
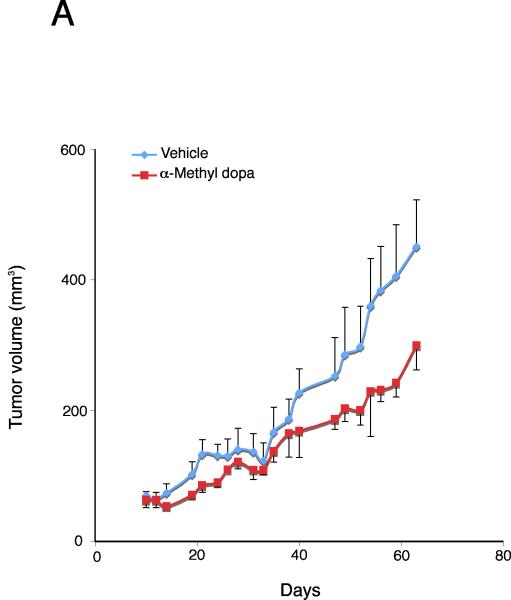
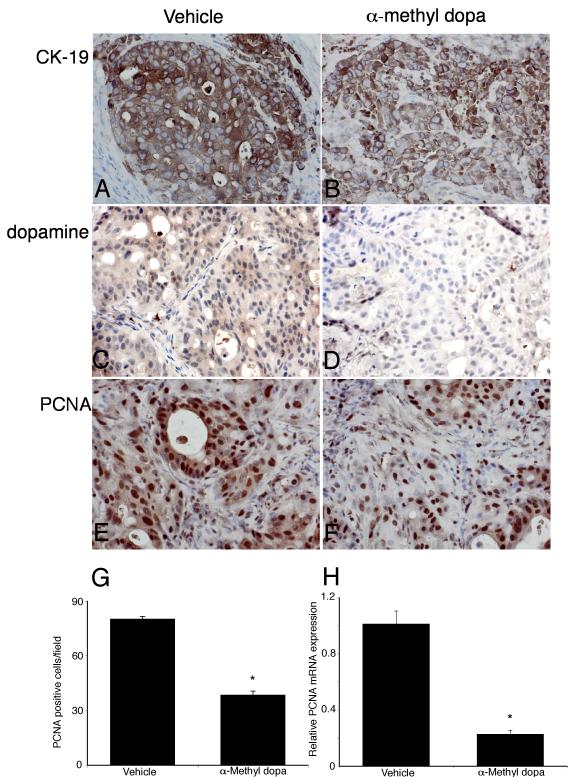
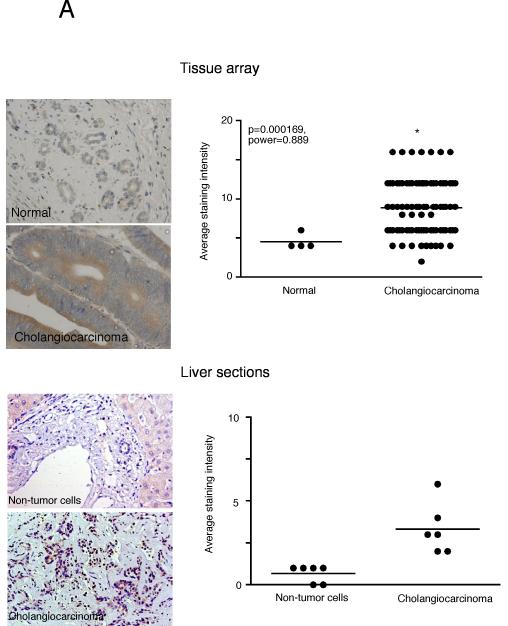
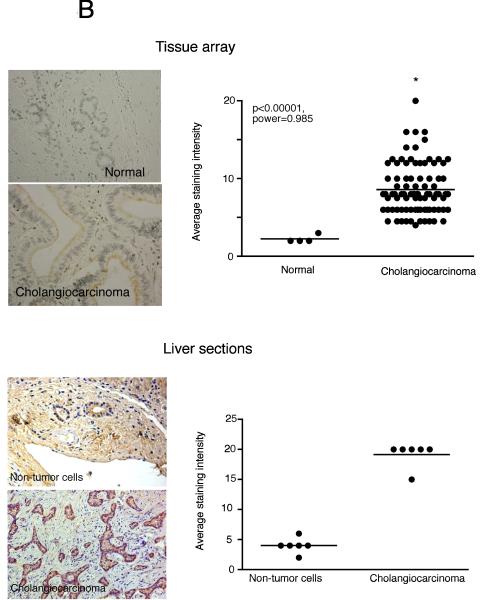
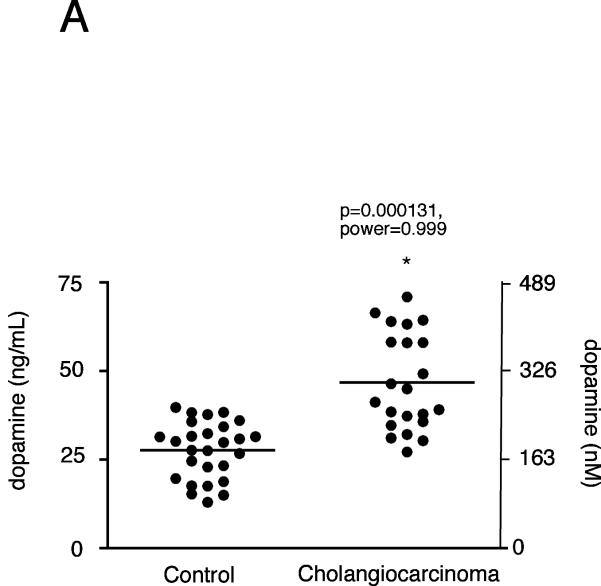
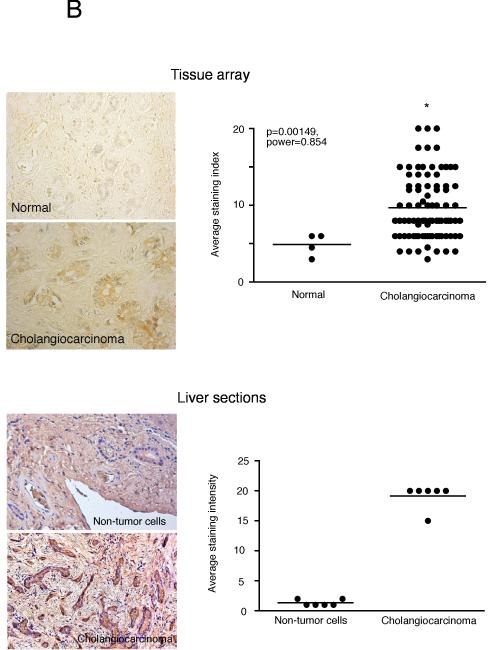
Cholangiocarcinoma is a devastating cancer of biliary origin with limited treatment options. Symptoms are usually evident after blockage of the bile duct by the tumor, and at this late stage, they are relatively resistant to chemotherapy and radiation therapy. Therefore, it is imperative that alternative treatment options are explored. We have previously shown that serotonin metabolism is dysregulated in cholangiocarcinoma leading to an increased secretion of serotonin, which has growth-promoting effects. Because serotonin and dopamine share the degradation machinery, we evaluated the secretion of dopamine from cholangiocarcinoma and its effects on cell proliferation. Using 4 cholangiocarcinoma cell lines and human biopsy samples, we demonstrated that there was an increase in mRNA and protein expression of the dopamine synthesis enzymes tyrosine hydroxylase and dopa decarboxylase in cholangiocarcinoma. There was increased dopamine secretion from cholangiocarcinoma cell lines compared to H69 and HIBEC cholangiocytes and increased dopamine immunoreactivity in human biopsy samples. Furthermore, administration of dopamine to all cholangiocarcinoma cell lines studied increased proliferation by up to 30%, which could be blocked by the pretreatment of the D2 and D4 dopamine receptor antagonists, whereas blocking dopamine production by alpha-methyldopa administration suppressed growth by up to 25%. Administration of alpha-methyldopa to nude mice also suppressed cholangiocarcinoma tumor growth. The data presented here represent the first evidence that dopamine metabolism is dysregulated in cholangiocarcinoma and that modulation of dopamine synthesis may represent an alternative target for the development of therapeutic strategies.


Figures

Figure 1
Figure 1
Enzymes responsible for dopamine synthesis are upregulated in cholangiocarcinoma cells in vitro. TH (A) and DDC (B) expression was assessed by real time PCR and immunoblotting in four cholangiocarcinoma cell lines as well as the non-malignant cholangiocyte cell lines H69 and HIBEC. In each case, data are expressed as average ± SEM (n=3). Asterisk denotes significance (p<0.05) compared with expression in H69 cells. Dopamine levels were also assessed in the supernatant of cell suspensions of cholangiocarcinoma cell lines and the non-malignant cholangiocyte cell lines H69 and HIBEC by EIA after 6 hr (C). Data are expressed as average dopamine concentration (ng/mL left axis and nMol, right axis) ± SEM (n=3). Asterisk denotes significance (p<0.05) compared with dopamine levels secreted from H69 cells.
Figure 1
Figure 1
Enzymes responsible for dopamine synthesis are upregulated in cholangiocarcinoma cells in vitro. TH (A) and DDC (B) expression was assessed by real time PCR and immunoblotting in four cholangiocarcinoma cell lines as well as the non-malignant cholangiocyte cell lines H69 and HIBEC. In each case, data are expressed as average ± SEM (n=3). Asterisk denotes significance (p<0.05) compared with expression in H69 cells. Dopamine levels were also assessed in the supernatant of cell suspensions of cholangiocarcinoma cell lines and the non-malignant cholangiocyte cell lines H69 and HIBEC by EIA after 6 hr (C). Data are expressed as average dopamine concentration (ng/mL left axis and nMol, right axis) ± SEM (n=3). Asterisk denotes significance (p<0.05) compared with dopamine levels secreted from H69 cells.
Figure 2
Figure 2
Dopamine increases cholangiocarcinoma cell proliferation in vitro. Cholangiocarcinoma cells and the non-malignant cholangiocyte cell lines, H69 and HIBEC, were treated with various concentrations of dopamine (10-9 M to 10-5 M) for 48 hr. Cell proliferation was assessed using an MTS cell proliferation assay. Data are expressed as fold change in proliferation (average ± SEM, n=7) and the asterisk denotes p<0.05 compared to basal treatment within each cell line.
Figure 3
Figure 3
Specific dopamine receptor antagonists inhibit the growth-promoting effects of dopamine. Mz-ChA-1 cells were pretreated with specific antagonists of the dopamine receptors indicated (all at 10 nM), prior to the addition of dopamine (100 nM) for 48 hr. Cell proliferation was assessed using an MTS cell proliferation assay. Data are expressed as fold change in proliferation (average ± SEM, n=7) and the asterisk denotes p<0.05 compared to antagonist alone.
Figure 4
Figure 4
Inhibition of dopamine synthesis decreases cholangiocarcinoma cell proliferation in vitro. Cholangiocarcinoma cells and the non-malignant cholangiocyte cell lines, H69 and HIBEC, were treated with various concentrations of α-methyl dopa (10-6 M to 10-8 M) for 48 hr. Cell proliferation was assessed using an MTS cell proliferation assay. Data are expressed as fold change in proliferation (average ± SEM, n=7) and the asterisk denotes p<0.05 compared to basal treatment within each cell line.
Figure 5
Figure 5
BrdU labeling of cholangiocarcinoma cells indicates changes in cell cycle progression after treatment with dopamine and α-methyl dopa. Mz-ChA-1 cells were treated with dopamine (10-7M) and CPA (10-6M) for 48 hr and BrdU uptake was determined. The number of BrdU-positive cells was expressed as a percentage of total cells. Data was expressed as the average ± SEM from 5 random fields from 3 independent experiments. Asterisk denotes significance (p<0.05) when compared to basal treatment.
Figure 6
Figure 6
Inhibition of dopamine synthesis decreases tumor growth in an in vivo xenograft model of cholangiocarcinoma. Mz-ChA-1 cells were injected into the flank of athymic mice. After tumors were established, mice were treated with 100 mg/kg/day (ip) α-methyl dopa, three days per week for 70 days and tumor volume assessed (A). Tumor latency was assessed as the time taken for the tumor to grow to 150% of the original size (B). Data are expressed as average latency (days ± SEM) and the asterisk denotes significance (p<0.05) from vehicle-treated tumors.
Figure 6
Figure 6
Inhibition of dopamine synthesis decreases tumor growth in an in vivo xenograft model of cholangiocarcinoma. Mz-ChA-1 cells were injected into the flank of athymic mice. After tumors were established, mice were treated with 100 mg/kg/day (ip) α-methyl dopa, three days per week for 70 days and tumor volume assessed (A). Tumor latency was assessed as the time taken for the tumor to grow to 150% of the original size (B). Data are expressed as average latency (days ± SEM) and the asterisk denotes significance (p<0.05) from vehicle-treated tumors.
Figure 7
Figure 7
Immunohistological analysis of tumors. Immunohistochemistry on tumors from vehicle- (A, C, E) and α-methyl dopa-treated mice was performed using specific antibodies against CK-19 (A, B), dopamine (C, D) and PCNA (E, F). Representative photomicrographs of the immunoreactivity are shown (magnification X40). Semi-quantitative analysis of PCNA immunoreactivity was performed and data was expressed as average (± SEM) PCNA positive nuclei per field (G) and the asterisk denotes significance (p<0.05) compared to vehicle-treated tumors. PCNA expression in the tumors was also assessed by real time PCR (H). Data are expressed as average ± SEM (n=3). Asterisk denotes significance (p<0.05) compared to vehicle-treated tumors.
Figure 8
Figure 8
Enzymes responsible for dopamine synthesis are upregulated in cholangiocarcinoma tumor biopsy samples. TH (A) and DDC (B) immunoreactivity was assessed in biopsy samples from 48 cholangiocarcinoma patients and 4 healthy controls by immunohistochemistry (upper panel) and in paraffin-embedded sections containing cholangiocarcinoma and the surrounding non-malignant liver tissue (n=6; lower panel). Representative photomicrographs of the TH (A) and DDC (B) immunoreactivity are shown (magnification X40). Staining intensity was assessed as described in the methods. P values and the power analysis values are shown in parentheses.
Figure 8
Figure 8
Enzymes responsible for dopamine synthesis are upregulated in cholangiocarcinoma tumor biopsy samples. TH (A) and DDC (B) immunoreactivity was assessed in biopsy samples from 48 cholangiocarcinoma patients and 4 healthy controls by immunohistochemistry (upper panel) and in paraffin-embedded sections containing cholangiocarcinoma and the surrounding non-malignant liver tissue (n=6; lower panel). Representative photomicrographs of the TH (A) and DDC (B) immunoreactivity are shown (magnification X40). Staining intensity was assessed as described in the methods. P values and the power analysis values are shown in parentheses.
Figure 9
Figure 9
Dopamine secretion in cholangiocarcinoma. Dopamine levels in bile samples from cholangiocarcinoma patients and patients with intrahepatic cholelithiasis were determined by EIA (A). Data are expressed in a scatter plot of dopamine concentration (ng/mL left axis and nMol right axis). Dopamine immunoreactivity was assessed in biopsy samples from 48 cholangiocarcinoma patients and 4 healthy controls by immunohistochemistry (upper panel) and in paraffin-embedded sections containing cholangiocarcinoma and the surrounding non-malignant liver tissue (n=6; lower panel). Representative photomicrographs of the dopamine immunoreactivity are shown (B; magnification X40). Staining intensity was assessed as described in the methods. P values and the power analysis values are shown in parentheses.
Figure 9
Figure 9
Dopamine secretion in cholangiocarcinoma. Dopamine levels in bile samples from cholangiocarcinoma patients and patients with intrahepatic cholelithiasis were determined by EIA (A). Data are expressed in a scatter plot of dopamine concentration (ng/mL left axis and nMol right axis). Dopamine immunoreactivity was assessed in biopsy samples from 48 cholangiocarcinoma patients and 4 healthy controls by immunohistochemistry (upper panel) and in paraffin-embedded sections containing cholangiocarcinoma and the surrounding non-malignant liver tissue (n=6; lower panel). Representative photomicrographs of the dopamine immunoreactivity are shown (B; magnification X40). Staining intensity was assessed as described in the methods. P values and the power analysis values are shown in parentheses.

Similar articles

Cited by

References

    1. Gores GJ. Cholangiocarcinoma: current concepts and insights. Hepatology. 2003;37:961–9. - PubMed
    1. Blechacz B, Gores GJ. Tumor-specific marker genes for intrahepatic cholangiocarcinoma: utility and mechanistic insight. J Hepatol. 2008;49:160–2. - PMC - PubMed
    1. Blechacz BR, Gores GJ. Cholangiocarcinoma. Clin Liver Dis. 2008;12:131–50. ix. - PubMed
    1. Sirica AE. Cholangiocarcinoma: molecular targeting strategies for chemoprevention and therapy. Hepatology. 2005;41:5–15. - PubMed
    1. Fava G, Alpini G, Rychlicki C, Saccomanno S, DeMorrow S, Trozzi L, Candelaresi C, Venter J, Di Sario A, Marzioni M, Bearzi I, Glaser S, et al. Leptin enhances cholangiocarcinoma cell growth. Cancer Res. 2008;68:6752–61. - PMC - PubMed

Publication types