. 2009 Dec;215(6):682-91.
doi: 10.1111/j.1469-7580.2009.01149.x. Epub 2009 Oct 1.

The elastin network: its relationship with collagen and cells in articular cartilage as visualized by multiphoton microscopy

Affiliations

The elastin network: its relationship with collagen and cells in articular cartilage as visualized by multiphoton microscopy

Jessica Mansfield et al. J Anat. 2009 Dec.

Abstract

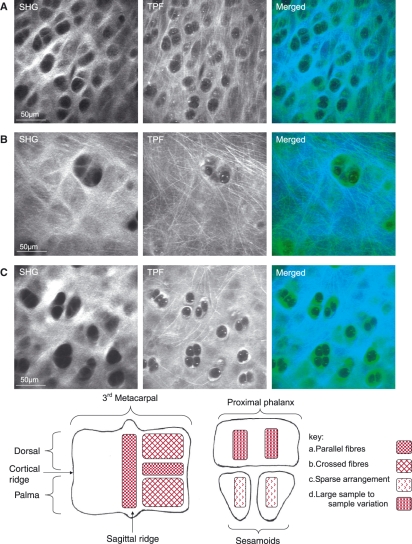
A combination of two-photon fluorescence (TPF), second harmonic generation (SHG) and coherent anti-Stokes Raman scattering (CARS) imaging has been used to investigate the elastin fibre network in healthy equine articular cartilage from the metacarpophalangeal joint. The elastin fibres were identified using their intrinsic two-photon fluorescence and immuno-staining was used to confirm the identity of these fibres. SHG was used to reveal the collagen matrix and the collagen fibre orientations were determined from their SHG polarization sensitivity, while CARS was used to clearly delineate the cell boundaries. Extensive elastin fibre networks were found in all the joint regions investigated. The elastin was found predominantly in the superficial zone (upper 50 microm) and was aligned parallel to the articular surface. Elastin was also detected in the pericellular matrix surrounding the superficial chondrocytes; however, individual fibres could not be resolved in this region. Variations in the density and organization of the fibres were observed in different regions on the joint surface.


Figures

Fig. 1
Fig. 1
A photograph of the opened equine metacarpophalangeal joint (top) and a schematic diagram to show the areas from which cartilage samples were removed.
Fig. 2
Fig. 2
Multiphoton imaging and immuno-staining of elastin fibres of a sample from the sagittal ridge of 7-year-old horse. (A) SHG image showing collagen distribution. (B) TPF image showing elastin fibres and intracellular fluorophores. Both images are en-face from the same area at a depth of 5 μm beneath the articular surface. (C–F) Immuno-stained images of the same specimen: (C,D) cross-sections viewed with fluorescence microscopy; in (C) the elastin fibres are immuno-stained with Cy3 and this is combined with a DAPI stain for cell nuclei in (D). (E) En-face multiphoton image of the sample with the elastin fibres immuno-stained with FITC. (F) A transverse section viewed using fluorescent microscopy which has been immuno-stained with FITC (elastin fibres) and DAPI (cell nuclei).
Fig. 3
Fig. 3
Montage of TPF images showing branching elastin fibres; all images are shown at the same scale. Branching elastin fibres were observed in the superficial zone of all the areas of cartilage shown in Fig. 1. The bright spots of fluorescence seen within the cells do not correspond to elastin fluorescence but instead are most likely attributable to the cellular fluorophores NAD(P)H and flavoproteins.
Fig. 5
Fig. 5
Multiphoton images taken at the cartilage periphery in a 4-year-old horse at different depths below the articular surface. (A) The articular surface showing a large number of elastin fibres. (B) Depth 5 μm. The elastin fibres lie within a meshwork of very coarse collagen fibres. (C) Depth 15 μm. There are still numerous elastin fibres, but the collagen fibres are finer and the tissue is more cellular. The number of fibres decreases at greater depths and they are scarce below 50 μm.
Fig. 4
Fig. 4
Multiphoton images taken at different areas on the articular surface (all at a depth of 3 μm from the articular surface) The SHG images show the collagen matrix and the TPF images show the elastin fibres and background fluorescence from the extracellular matrix. In the merged images blue = SHG and green = TPF. Parallel elastin fibres were found in the cortical ridge area (A); this pattern of fibres was also repeated on the sagittal ridge (image not shown). A dense network of crossed fibres were seen in the palma and dorsal regions (B). The sesamoids showed a sparser network of elastin fibres with no apparent preferred orientation (C). The schematic diagram summarizes the elastin organizations found in the different regions of the joint.
Fig. 6
Fig. 6
The relationship between collagen and elastin fibre orientation. (A) Plot of the SHG intensity (normalized with respect to the mean intensity) as a function of the polarization angle of the laser source; the maximum SHG intensity is at 90° and 270°, indicating that the collagen fibres are predominantly aligned in this direction. (B) SHG image of the area investigated with the direction of the collagen fibres marked in the bottom right. (C) TPF image taken of the same area showing the parallel elastin fibres. This data was taken from the cortical ridge of an 8-year-old horse at a depth of 5 μm from the surface.
Fig. 7
Fig. 7
En-face multiphoton imaging of cells in the superficial zone articular cartilage (A–C). (D) CARS image of the pair of cells in false colours to highlight the cell membrane. In this scheme, low-intensity pixels appear red and the high intensity pixels green. In the merged image (E) the SHG signal is blue, the TPF signal is green and the CARS signal is red. The intensity profiles across two of the cells are shown in (F). In the profile, the intensity of the three modalities has been normalized to one in the interterritorial matrix, the grey bounds on the profile show the approximate location of the cell membrane. These images were taken on the palma region of an 8-year-old horse.

Similar articles

Cited by

References

    1. Benninghoff A. Form und Bau der Gelenkknorpel in ihren Beziehungen zur Funktion. II. Der Aufbau des Gelenkknorpels in seinen Beziehungen zur Funktion. Z Zellforsch Mikrosk Anat. 1925;2:783–862.
    1. Boulesteix T, Pena AM, Pages N, et al. Micrometer scale ex vivo multiphoton imaging of unstained arterial wall structure. Cytometry A. 2006;69A:20–26. - PubMed
    1. Brama PAJ, Karssenberg D, Barneveld A, et al. Contact areas and pressure distribution on the proximal articular surface of the proximal phalanx under sagittal plane loading. Equine Vet J. 2001;33:26–32. - PubMed
    1. Brockbank KGM, MacLellan WR, Xie JS, et al. Quantitative second harmonic generation imaging of cartilage damage. Cell Tissue Banking. 2008;9:299–307. - PubMed
    1. Broom ND, Ngo T, Tham E. Traversing the intact/fibrillated joint surface: a biomechanical interpretation. J Anat. 2005;206:55–67. - PMC - PubMed

Publication types

LinkOut - more resources