

US emergency department performance on wait time and length of visit
- PMID: 19796844
- PMCID: PMC2830619
- DOI: 10.1016/j.annemergmed.2009.07.023
US emergency department performance on wait time and length of visit
Abstract
Study objective: Prolonged emergency department (ED) wait time and length of visit reduce quality of care and increase adverse events. Previous studies have not examined hospital-level performance on ED wait time and visit length in the United States. The purpose of this study is to describe hospital-level performance on ED wait time and visit length.
Methods: We conducted a retrospective cross-sectional study of a stratified random sampling of 35,849 patient visits to 364 nonfederal US hospital EDs in 2006, weighted to represent 119,191,528 visits to 4,654 EDs. Measures included EDs' median wait times and visit lengths, EDs' median proportion of patients treated by a physician within the time recommended at triage, and EDs' median proportion of patients dispositioned within 4 or 6 hours.
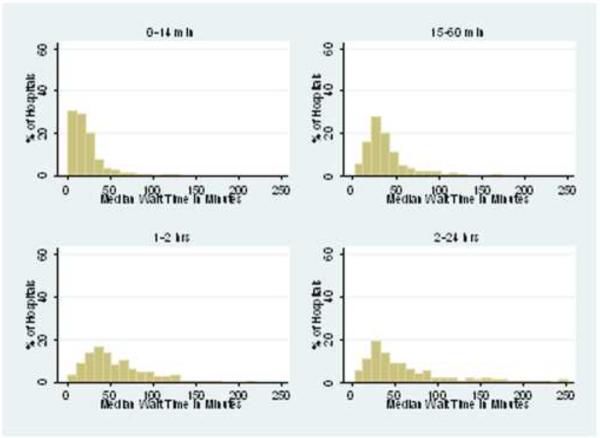
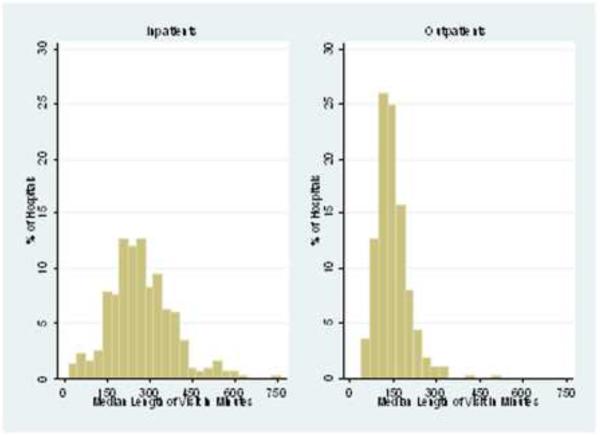
Results: In the median ED, 78% (interquartile range [IQR], 63% to 90%) of all patients and 67% (IQR, 52% to 82%) of patients who were triaged to be treated within 1 hour were treated by a physician within the target triage time. A total of 31% of EDs achieved the triage target for more than 90% of their patients; 14% of EDs achieved the triage target for 90% or more of patients triaged to be treated within an hour. In the median ED, 76% (IQR 54% to 94%) of patients were admitted within 6 hours. A total of 48% of EDs admitted more than 90% of their patients within 6 hours, but only 25% of EDs admitted more than 90% of their patients within 4 hours.
Conclusion: A minority of hospitals consistently achieved recommended wait times for all ED patients, and fewer than half of hospitals consistently admitted their ED patients within 6 hours.
Copyright (c) 2009. Published by Mosby, Inc.
Figures
References
-
- Institute of Medicine . Hospital-based emergency care: At the breaking point. National Academy of Sciences; Washington, DC: 2006.
-
- Wilper AP, Woolhandler S, Lasser KE, et al. Waits to see an emergency department physician: U.S. trends and predictors, 1997–2004. Health Aff (Millwood) 2008 Mar-Apr;27(2):w84–95. - PubMed
-
- Herring A, Wilper A, Himmelstein DU, et al. Increasing Length of Stay Among Adult Visits to U.S. Emergency Departments, 2001–2005. Acad Emerg Med. 2009 Jun 15; DOI:10.1111/j.1553-2712.2009.00428.x. - PubMed
-
- United States Government Accountability Office Hospital emergency departments; crowding continues to occur, and some patients wait longer than recommended time frames. 2009;Vol GAO-09-347
-
- Liew D, Liew D, Kennedy MP. Emergency department length of stay independently predicts excess inpatient length of stay. Med J Aust. 2003 Nov 17;179(10):524–526. - PubMed
Publication types
MeSH terms
Grants and funding
LinkOut - more resources
Full Text Sources
