. 2009 Nov 13;284(46):32002-14.
doi: 10.1074/jbc.M109.046938. Epub 2009 Sep 21.

Total expression and dual gene-regulatory mechanisms maintained in deletions and duplications of the Pcdha cluster

Affiliations

Total expression and dual gene-regulatory mechanisms maintained in deletions and duplications of the Pcdha cluster

Yukiko Noguchi et al. J Biol Chem. .

Abstract

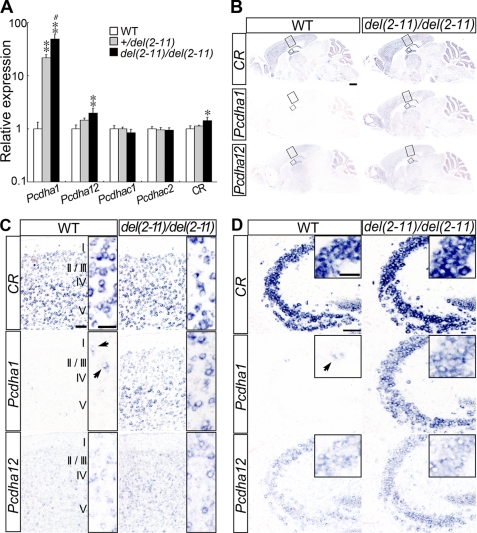
The clustered protocadherin-alpha (Pcdha) genes, which are expressed in the vertebrate brain, encode diverse membrane proteins whose functions are involved in axonal projection and in learning and memory. The Pcdha cluster consists of 14 tandemly arranged genes (Pcdha1-Pcdha12, Pcdhac1, and Pcdhac2, from 5' to 3'). Each first exon (the variable exons) is transcribed from its own promoter, and spliced to the constant exons, which are common to all the Pcdha genes. Cerebellar Purkinje cells show dual expression patterns for Pcdha. In individual Purkinje cells, different sets of the 5' genes in the cluster, Pcdha1-12, are randomly expressed, whereas both 3' genes, Pcdhac1 and Pcdhac2, are expressed constitutively. To elucidate the relationship between the genomic structure of the Pcdha cluster and their expression in Purkinje cells, we deleted or duplicated multiple variable exons and analyzed the expression of Pcdha genes in the mouse brain. In all mutant mice, transcript levels of the constant exons and the dual expression patterns were maintained. In the deletion mutants, the missing genes were flexibly compensated by the remaining variable exons. On the other hand, in duplication mutants, the levels of the duplicated genes were trimmed. These results indicate that the Pcdha genes are comprehensively regulated as a cluster unit, and that the regulators that randomly and constitutively drive Pcdha gene expression are intact in the deleted or duplicated mutant alleles. These dual regulatory mechanisms may play important roles in the diversity and fundamental functions of neurons.


Figures

FIGURE 1.
FIGURE 1.
loxP-insertion, deletion, and duplication alleles in the variable region of the Pcdha cluster. A, genomic structure of the Pcdha wild-type (WT) allele. It consists of 14 first exons (white boxes) in the variable region and three CR exons (CR1–CR3, black boxes) in the constant region. The first exons are termed a1–a12, ac1, and ac2, from 5′ to 3′. Pcdha genes are produced by splicing each first exon to the CR exons, and termed Pcdha1–Pcdha12, Pcdhac1, and Pcdhac2. DNase I-hypersensitive sites (HS5-1 and HS7) are shown as ovals. Arrows indicate the direction of transcription. B, G1loxP allele: a loxP site was inserted between ac2 and CR1. C, G16Neo allele: loxP sites were inserted between a1 and a2 (see supplemental Fig. S1 for details). D, 11R allele: an HcRed gene (red box), a loxP site, and an internal ribosome entry site (ires, yellow box) were inserted between the promoter and coding region of a11 (see supplemental Fig. S2 for details). E, the del(11-c2) allele: deletion of a11–ac2. F, the del(2–11) allele: deletion of a2-a11. G, the dup(2–10) allele: duplication of a2-a10. H, the dup(12-c2) allele: duplication of a12-ac2. The del(11-c2) and dup(12-c2) alleles were produced by Cre-loxP-mediated trans-allelic meiotic recombination between the 11R and G1loxP alleles. The del(2–11) and dup(2–10) alleles were produced from the G16Neo and 11R alleles. The deleted DNA segments are indicated by dashed lines, and the duplicated segments are shown under the position of the original segment. The loxP sites are shown as blue triangles.
FIGURE 2.
FIGURE 2.
Expression of Pcdha genes in Pcdha+/del(11-c2) and Pcdhadel(11-c2)/del(11-c2) mice. A, qRT-PCR analysis of Pcdha transcripts in the brain of WT (n = 4), Pcdha+/del(11-c2) (n = 4), and Pcdhadel(11-c2)/del(11-c2) mice (n = 4) on postnatal day 21 (P21). Expression levels are shown as the ratio to WT. The CR transcript level was unchanged in the mutants. The Pcdha1, Pcdha2, and Pcdha10 transcripts were increased, and those of Pcdha5 to Pcdha7 were decreased in the deletion mutants. The Pcdha6, Pcdha7, and Pcdha10 levels of the Pcdhadel(11-c2)/del(11-c2) mice were significantly changed compared with Pcdha+/del(11-c2) mice. *, p < 0.05; **, p < 0.01, versus WT; #, p < 0.05, versus Pcdha+/del(11-c2) mice. Data are shown as the mean ± S.D. B, distribution of the CR and Pcdha10 transcripts in sagittal sections of the WT and Pcdhadel(11-c2)/del(11-c2) brain at P21, examined by in situ hybridization. Anterior is to the left, posterior to the right. Scale bar, 1 mm. The frames correspond to the fields displayed in C and D. C, expression patterns of the CR and Pcdha10 transcripts in the P21 cerebral cortex of WT and Pcdhadel(11-c2)/del(11-c2) mice, examined by in situ hybridization. Scale bar, 100 μm. Frames show the high-magnification insets. Scale bar, 5 μm. D, expression pattern of the CR and Pcdha10 transcripts in the CA3 region of the hippocampus in WT and Pcdhadel(11-c2)/del(11-c2) mice at P21, examined by in situ hybridization. Scale bar, 100 μm. B–D, the expression pattern of the CR transcripts was not significantly altered, but the number of cells expressing Pcdha10 dramatically increased in the Pcdhadel(11-c2)/del(11-c2) brain. Arrows show Pcdha10-positive cells in the insets of WT mice.
FIGURE 3.
FIGURE 3.
In situ hybridization analysis of Pcdha genes in the Purkinje cells of Pcdhadel(11-c2)/del(11-c2) mice. A, expression of the CR, Pcdha10, and Pcp2 transcripts in the 2nd cerebellar lobules of WT and Pcdhadel(11-c2)/del(11-c2) mice at P21 by in situ hybridization. Anterior is to the left, posterior to the right. Scale bar, 100 μm. In the Pcdha10 image, asterisks indicate signal-positive Purkinje cells that were accepted as countable. The high-magnification insets show the Purkinje cells indicated by arrows. Scale bar, 10 μm. B, Pcdha10-positive Purkinje cells relative to the number of Pcp2-positive cells in the Pcdhadel(11-c2)/del(11-c2) cerebellum, showing a significant increase compared with WT. **, p < 0.01. Data are shown as the mean ± S.D.
FIGURE 4.
FIGURE 4.
In situ hybridization analysis of Pcdha genes in the Pcdhadel(11-c2)/del(11-c2) cerebellum. Distribution of the Pcdha1–Pcdha10 and Pcp2 transcripts in the 2nd cerebellar lobules of WT and Pcdhadel(11-c2)/del(11-c2) mice at P21, by in situ hybridization. Serials sections of the WT or Pcdhadel(11-c2)/del(11-c2) cerebellum were probed, and the positive-cell frequency of each randomly expressed gene varied widely in each section (see supplemental Note 2). Anterior is to the left, posterior to the right. The Pcdha1–Pcdha9 genes showed a random expression pattern in the Purkinje cells of WT and Pcdhadel(11-c2)/del(11-c2) mice, but the expression pattern of Pcdha10 changed from a weak random expression in WT mice to a strong constitutive expression in Pcdhadel(11-c2)/del(11-c2) mice. The Pcdha7/8 probe recognized the Pcdha7 and Pcdha8 transcripts. The Pcdha9 probe did not give a clear signal. Asterisks indicate signal-positive Purkinje cells except for Pcp2. Scale bar, 100 μm.
FIGURE 5.
FIGURE 5.
Single cell RT-PCR and SNP analysis of the Pcdha genes in individual Purkinje cells of Pcdha+/del(11-c2) mice. A, by mating Pcdhadel(11-c2)/del(11-c2) (CBA) and WT (JF1) mice, the first filial generation (F1) mice, namely Pcdha+/del(11-c2), were generated. After reverse transcription of the RNAs of a single Purkinje cell isolated from the cerebellum neurons, the cDNA was split into three tubes. In each tube, PCR was performed using primers for the specific genes. B, electrophoresis results of the second-round PCR products by the split single cell RT-PCR for the Pcdha and Pcp2 genes in individual Purkinje cells. #1-17 numbers designate individual cells. 1–3, tubes into which the cDNA from an individual Purkinje cell was divided; independent PCRs were performed for each tube. C, after sequencing the PCR products, SNP analysis was used to distinguish between Pcdha transcripts from the del(11-c2) allele and those from the WT allele. Transcripts from the WT and the del(11-c2) alleles are shown as blue and red circles, respectively. The Pcdha6 gene has no SNP between the B6 and JF1 strains, and is undistinguishable. Transcripts that were undistinguishable or not determined are shown as plus signs. Nonspecific bands are shown as minus signs. Pcdha10 was clearly expressed from the del(11-c2) allele in all the cells examined.
FIGURE 6.
FIGURE 6.
Expression of Pcdha genes in Pcdha+/del(2–11) and Pcdhadel(2–11)/del(2–11) mice. A, qRT-PCR analysis of Pcdha transcripts in the brain of WT (n = 4), Pcdha+/del(2–11) (n = 4), and Pcdhadel(2–11)/del(2–11) mice (n = 4) at P21. The levels of Pcdha1, Pcdha12, and CR transcripts in the Pcdhadel(2–11)/del(2–11) mice increased significantly compared with WT. The Pcdhac1 and Pcdhac2 transcript levels were unchanged. The Pcdha1 expression level of Pcdhadel(2–11)/del(2–11) mice was significantly different from that of the Pcdha+/del(2–11) mice. Expression levels are shown as the ratio to WT. *, p < 0.05; **, p < 0.01, versus WT; ##, p < 0.01, versus Pcdha+/del(2–11) mice. Data are shown as the mean ± S.D. B, expression of the CR, Pcdha1, and Pcdha12 transcripts in sagittal sections of WT and Pcdhadel(2–11)/del(2–11) brains at P21, examined by in situ hybridization. Anterior is to the left, posterior to the right. Scale bar, 1 mm. Frames correspond to the fields displayed in C and D. C, the expression patterns of CR, Pcdha1, and Pcdha12 transcripts in the cerebral cortex of WT and Pcdhadel(2–11)/del(2–11) brains at P21, examined by in situ hybridization. Scale bar, 100 μm. D, the expression patterns of CR, Pcdha1, and Pcdha12 transcripts in the CA3 region of the hippocampus of the WT and Pcdhadel(2–11)/del(2–11) brain at P21 by in situ hybridization. Scale bar, 100 μm. B–D, there was no obvious difference in the distribution of CR transcripts between the WT and Pcdhadel(2–11)/del(2–11) brains, whereas the level of the Pcdha1 transcript clearly increased. The level of Pcdha12 was also slightly increased in the Pcdhadel(2–11)/del(2–11) mice. Arrows show Pcdha1-positive cells in the insets of WT mice.
FIGURE 7.
FIGURE 7.
In situ hybridization analysis of Pcdha genes in the Purkinje cells of Pcdhadel(2–11)/del(2–11) mice. A, expression of CR, Pcdha1, Pcdha12, and Pcp2 transcripts in the 3rd cerebellar lobules of the WT and Pcdhadel(2–11)/del(2–11) mice at P21 by in situ hybridization. Anterior is to the left, posterior to the right. Scale bar, 100 μm. In Pcdha1 and Pcdha12, asterisks indicate signal-positive Purkinje cells that were considered acceptable for counting. The high-magnification insets show the Purkinje cells indicated by arrows. Scale bar, 20 μm. B, numbers of Pcdha1- and Pcdha12-positive Purkinje cells relative to the number of Pcp2-positive cells in the Pcdhadel(2–11)/del(2–11) cerebellum, showing a significant increase compared with WT. **, p < 0.01. Data are shown as the mean ± S.D.
FIGURE 8.
FIGURE 8.
Single cell RT-PCR and SNP analysis of Pcdha genes in individual Purkinje cells of Pcdha+/del(2–11) mice. A, by mating Pcdhadel(2–11)/del(2–11) (CBA) and WT (JF1) mice, the first filial generation (F1) mice, namely Pcdha+/del(2–11), were generated. After reverse transcription of the RNAs of a single Purkinje cell isolated from the cerebellum neurons, the cDNA was synthesized and split into three tubes. In each tube, PCR was performed using specific primers for a1, a12, c1, and c2. B, electrophoresis results of the second-round PCR products by split single cell RT-PCR analysis in individual Purkinje cells. #1–21 numbers designate individual Purkinje cells. 1–3 are tubes into which the cDNA from a single cell was divided; independent PCRs were performed for each tube. C, after sequencing the PCR products, SNP analysis was performed to distinguish between Pcdha transcripts from the del(2–11) allele and those from the WT allele. Transcripts from the WT and del(2–11) alleles are shown as blue and red circles, respectively. Transcripts that were undistinguishable or not determined are shown as plus signs. Nonspecific bands are shown as minus signs. All the Purkinje cells expressed Pcdha1 and/or Pcdha12.
FIGURE 9.
FIGURE 9.
Expression of Pcdha genes in the P21 brain of Pcdha+/dup(2–10) and Pcdhadup(2–10)/dup(2–10) mice. A, qRT-PCR analysis of Pcdha transcripts in the brain of WT (n = 4), Pcdha+/dup(2–10) (n = 3), and Pcdhadup(2–10)/dup(2–10) mice (n = 4) at P21. Expression levels are shown as the ratio to WT. The CR transcript levels were unchanged. The Pcdha1, Pcdha2, Pcdha7, Pcdha8, and Pcdha10 transcripts decreased significantly. The Pcdha1 levels of Pcdhadup(2–10)/dup(2–10) mice were significantly different from those of the Pcdha+/dup(2–10) mice. *, p < 0.05; **, p < 0.01, versus WT; #, p < 0.05, versus Pcdha+/dup(2–10) mice. Data are shown as the mean ± S.D. B, expression of CR transcripts in sagittal sections of WT and Pcdhadup(2–10)/dup(2–10) brains at P21, examined by in situ hybridization. Anterior is to the left, posterior to the right. The expression of CR in the Pcdhadup(2–10)/dup(2–10) mice was unchanged compared with WT mice. Scale bar, 1 mm.
FIGURE 10.
FIGURE 10.
Expression of Pcdha genes in the P21 brain of Pcdha+/dup(12-c2) and Pcdhadup(12-c2)/dup(12-c2) mice. A, qRT-PCR analysis of Pcdha transcripts in the brain of WT (n = 3), Pcdha+/dup(12-c2) (n = 3), and Pcdhadup(12-c2)/dup(12-c2) mice (n = 3) at P21. Expression levels are shown as the ratio to WT. The levels of the CR transcript were unchanged. The Pcdha6 and Pcdha9–Pcdha11 transcript levels decreased significantly, and that of Pcdhac2 increased. *, p < 0.05; **, p < 0.01. Data are shown as the mean ± S.D. B, expression of the CR transcript in sagittal sections of WT and Pcdhadup(12-c2)/dup(12-c2) brains at P21, examined by in situ hybridization. The expression of CR in the Pcdhadup(12-c2)/dup(12-c2) mice was unchanged compared with WT mice. Scale bar, 1 mm.
FIGURE 11.
FIGURE 11.
A phase diagram of the random and constitutive expression of Pcdha genes in the WT, deleted, and duplicated alleles. Genomic structures from top to bottom show the WT, del(11-c2), del(2–11), dup(2–10), and dup(12-c2) alleles. Both random and constitutive regulation always occurred for all of these alleles. The variable exons located the most 3′ in the variable region are expressed constitutively (red arrows). The variable exons located in the 5′ portion of the variable region are expressed randomly (blue arrows). The arrows indicate the direction of transcription. HS5-1 and HS7 enhancers are shown as ovals. Open boxes, variable exons. Black bars and boxes, constant region exons. i, internal ribosome entry site. H, HcRed.

Similar articles

Cited by

References

    1. Imai T., Sakano H. (2008) Curr. Opin. Neurobiol. 18, 251–260 - PubMed
    1. Lomvardas S., Barnea G., Pisapia D. J., Mendelsohn M., Kirkland J., Axel R. (2006) Cell 126, 403–413 - PubMed
    1. Serafini T. (1999) Cell 98, 133–136 - PubMed
    1. Kohmura N., Senzaki K., Hamada S., Kai N., Yasuda R., Watanabe M., Ishii H., Yasuda M., Mishina M., Yagi T. (1998) Neuron 20, 1137–1151 - PubMed
    1. Esumi S., Kakazu N., Taguchi Y., Hirayama T., Sasaki A., Hirabayashi T., Koide T., Kitsukawa T., Hamada S., Yagi T. (2005) Nat. Genet. 37, 171–176 - PubMed

Publication types

MeSH terms

LinkOut - more resources