. 2009 Dec 25;284(52):36083-36098.
doi: 10.1074/jbc.M109.025825. Epub 2009 Sep 21.

BRCA1 localization to the telomere and its loss from the telomere in response to DNA damage

Affiliations

BRCA1 localization to the telomere and its loss from the telomere in response to DNA damage

Rahul D Ballal et al. J Biol Chem. .

Abstract

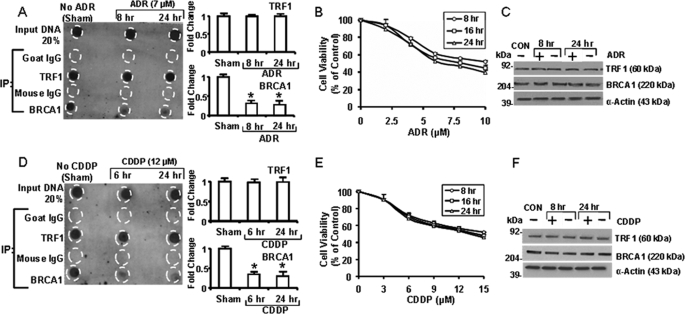
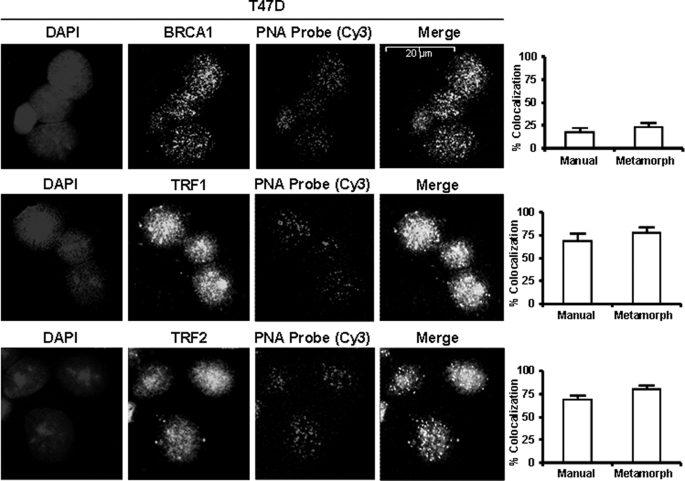
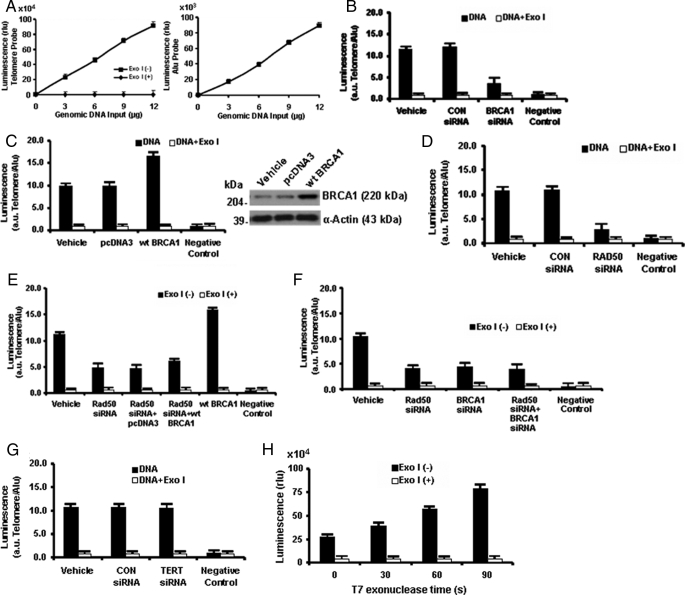
BRCA1, a tumor suppressor, participates in DNA damage signaling and repair. Previously, we showed that BRCA1 overexpression caused inhibition of telomerase activity and telomere shortening in breast and prostate cancer cells. We now report that BRCA1 knockdown causes increased telomerase reverse transcriptase expression, telomerase activity, and telomere length; but studies utilizing a combination of BRCA1 and telomerase reverse transcriptase small interfering RNAs suggest that BRCA1 also regulates telomere length independently of telomerase. Using telomeric chromatin immunoprecipitation assays, we detected BRCA1 at the telomere and demonstrated time-dependent loss of BRCA1 from the telomere following DNA damage. Further studies suggest that BRCA1 interacts with TRF1 and TRF2 in a DNA-dependent manner and that some of the nuclear BRCA1 colocalizes with TRF1/2. Our findings further suggest that Rad50 is required to localize BRCA1 at the telomere and that the association of BRCA1 with Rad50 does not require DNA. Finally, we found that BRCA1 regulates the length of the 3' G-rich overhang in a manner that is dependent upon Rad50. Our findings suggest that BRCA1 is recruited to the telomere in a Rad50-dependent manner and that BRCA1 may regulate telomere length and stability, in part through its presence at the telomere.


Figures

FIGURE 1.
FIGURE 1.
BRCA1 knockdown causes increased hTERT expression, telomerase activity, and telomere length. A and B, subconfluent proliferating T47D cells were treated with BRCA1 siRNA (100 nm), control siRNA (100 nm), or vehicle for 72 h and harvested for semiquantitative RT-PCR assays (A) or Western blotting (B) for hTERT, BRCA1, and actin (control gene). The PCR product and protein bands were quantified by densitometry, expressed relative to actin, and normalized to the control (vehicle-treated cells). C, T47D cells treated with siRNAs were tested for telomerase activity using the TRAPEZE assay. A Western blot to confirm the BRCA1 knockdown is included. Telomerase activity was calculated as total product-generated units and normalized to the vehicle control. Note that TSK is an internal control for standardization of the assay, and a no sample negative control is included. D, MCF-7 or T47D cells were treated with BRCA1 siRNA, control (CON) siRNA, or vehicle over a period of 21 days with replating in fresh medium plus siRNA every 3 days. The cells were then assayed to determine telomere length by Southern blotting. Telomere length was quantitated as the mean telomere repeat fragment (TRF) length. All values shown in A–D are means ± S.E. of three independent experiments. *, p < 0.05 (two-tailed t test).
FIGURE 2.
FIGURE 2.
BRCA1 siRNA blocks telomere shortening due to TERT knockdown. A and B, T47D cells were treated with BRCA1 siRNA (100 nm), TERT siRNA (100 nm), BRCA1 siRNA plus TERT siRNA (100 nm each), or control (CON) siRNA (200 nm). The total siRNA concentration was kept constant at 200 nm by the addition of control siRNA. Cells were passaged every 3 days into fresh medium containing fresh siRNA. Cells were assayed at the indicated passage for telomere length by Southern blotting as in Fig. 1. Values plotted are means ± ranges of two independent experiments. C, cells were assayed for telomerase activity after passage 6 (see Fig. 1). Values are means ± S.E. of three experiments. D, Western blots are provided to show the effects of siRNA treatments on BRCA1 and TERT levels after passage 6.
FIGURE 3.
FIGURE 3.
Telomeric ChIP assays to detect telomeric BRCA1 protein in T47D cells. A, cells were subjected to ChIP assays using anti-BRCA1 as the IP antibody and different amounts of chromatin. The precipitated DNA was hybridized with a telomeric probe or an Alu probe. Dot blots are shown using anti-BRCA1 or normal mouse IgG as the IP antibody. The graph on the right shows the signal/input ratio from the BRCA1 IPs as a function of the quantity of chromatin used in the assay. B and D, dot blots and densitometry quantification for telomeric ChIP assays after treatment of cells with adriamycin (ADR; 7 μm) (B) or cis-platinum (CDDP; 12 μm) (D) for the indicated times. Assays were performed using 6 μg of chromatin with IP antibodies against BRCA1, TRF1, or the corresponding normal IgG types. Graphs on the right show quantification of the telomeric TRF1 and BRCA1 content. C and E, Western blots for TRF1 and BRCA1 for cells treated with or without ADR or CDDP. All values plotted in A, B, and D are means ± S.E. of three independent experiments (*, p < 0.05, relative to sham-treated control).
FIGURE 4.
FIGURE 4.
Adriamycin and cis-platinum cause loss of telomeric BRCA1 in T47D cells. Cells were sham-treated or exposed to ADR or CDDP for the indicated times and harvested for telomeric ChIP assays to detect TRF1 and BRCA1 (A and D). As negative controls, ChIP assays were performed using normal goat IgG (control for TRF1 IP) or mouse IgG (control for BRCA1 IP). Dot blots were quantified using densitometry, normalized to the input, and expressed relative to sham-treated controls, as means ± S.E. of three independent experiments (*, p < 0.05 relative to controls). B and E show MTT assays for cells treated with ADR or CDDP for 8, 16, or 24 h and assayed 24 after treatment. C and F provide Western blots to show the effects of ADR or CDDP on TRF1, BRCA1, and α-actin levels.
FIGURE 5.
FIGURE 5.
Knockdown of TRF1 or TRF2 causes loss of telomeric BRCA1 (but not vice versa) in T47D cells. Cells were treated with TRF1 siRNA (A and B), TRF2 siRNA (C and D), BRCA1 siRNA (E and F), control siRNA (100 nm), or vehicle for 72 h and harvested for telomeric ChIP assays using antibodies against TRF1, TRF2, and BRCA1 or using normal IgG as a control (goat IgG (TRF1), rabbit IgG (TRF2), mouse IgG (BRCA1)). In A, C, and E, the left panels show representative ChIP dot blots, whereas the right panels show densitometry quantification based on three independent experiments (*, p < 0.05). B, D, and E, Western blots to document the TRF1, TRF2, and BRCA1 knockdowns.
FIGURE 6.
FIGURE 6.
BRCA1 association with TRF1 and TRF2 is mediated by DNA. Cells were subjected to reciprocal IP-Western blotting for BRCA1/TRF1 (A and C) or BRCA1/TRF2 (B and D). In C and D, IPs were carried out using lysates pretreated with or without DNase I (100 units/ml for 30 min at 37 °C). For each IP, a control IP using the same quantity of normal IgG was performed, and an input lane is provided corresponding to 10% of the amount of protein used for IP. E, Western blots of unprecipitated lysates treated with or without DNase I; F, electrophoresis of lysates pretreated with or without DNase I on a 1% agarose gel.
FIGURE 7.
FIGURE 7.
Colocalization of BRCA1 with TRF1 and TRF2. Subconfluent proliferating T47D cells were sham-treated or exposed to ADR (7 μm) for 8 h and processed for confocal microscopy. Images are shown of DAPI stain (nuclei), BRCA1 immunostaining (green), TRF1 or TRF2 immunostaining (red), and merged BRCA1 plus TRF1 (A) or BRCA1 plus TRF2 (B) images. Yellow granules in the merged images indicate regions of colocalization. Quantitation of colocalization of BRCA1/TRF1 and BRCA1/TRF2 was carried out using Metamorph version 6.2 software (n = 25 cells).
FIGURE 8.
FIGURE 8.
Teli-FISH of BRCA1 colocalization with telomeric probe. Subconfluent proliferating T47D cells on slides were fixed and hybridized to a Cy3-labeled telomere-specific PNA probe. The slides were immunostained with BRCA1, TRF1, or TRF2 primary antibody and secondary antibody conjugated to Alexa Fluor dye and processed for confocal imaging. Images are shown of DAPI stain (blue), PNA probe (red), BRCA1 (green), TRF1 (green), or TRF2 (green). Quantification of colocalization of BRCA1, TRF1, or TRF2 with the PNA probe (yellow granules in merged images) was carried out using Metamorph version 6.2 software (n = 28) or by manual counting of the percentage of total telomeric granules (yellow + red) that is colocalized (yellow) with BRCA1, TRF1, or TRF2 (n = 3 cells).
FIGURE 9.
FIGURE 9.
Rad50 knockdown causes loss of telomeric BRCA1 in T47D cells. A and B, cells were treated with Rad50 siRNA (A), BRCA1 siRNA (B), control siRNA (100 nm), or vehicle for 72 h and harvested for telomeric ChIP assays using IP antibodies against Rad50, BRCA1, and TRF1 and normal IgGs as controls (goat IgG (TRF1), mouse IgG (Rad50 and BRCA1)). Typical dot blots and densitometry quantitation based on three independent experiments are shown (*, p < 0.05). C, Western blots to document the Rad50 and BRCA1 knockdowns. D–F, cells were sham-treated or exposed to ADR for the indicated time intervals and then harvested for telomeric ChIP assays to detect Rad50, BRCA1, and TRF1 (D and E). Representative dot blots and densitometric quantification based on three experiments are shown (*, p < 0.05). F, Western blots to show the effects of ADR on whole cell Rad50, BRCA1, and α-actin protein levels.
FIGURE 10.
FIGURE 10.
BRCA1 regulates 3′ G-strand overhang length; hybridization protection assay. A, standard curves of luminescence (relative units) versus genomic DNA input were obtained using an AE-labeled telomeric probe (left) or an AE-labeled AluDNA probe (right). Data are shown for DNA treated with or without Exo I, which removes single-stranded DNA. B–G, cells were treated with the indicated siRNAs and/or transfected overnight with wild-type (wt) BRCA1 or empty pcDNA3 vector, and genomic DNA (5 μg) was assayed to determine the ratio of luminescence (arbitrary units (a.u.)) obtained using the telomeric and Alu probes. Controls using Exo I and, in some cases, negative controls (no DNA) are provided. C, a Western blot to document overexpression of BRCA1 in cells transfected with wild-type BRCA1. H, the telomeric probe signal for genomic DNA (5 μg) treated with T7 exonuclease (which digests duplex DNA, but not single-stranded DNA, in a 5′ to 3′ direction) for different time intervals. All data are means ± S.E. of three independent experiments.
FIGURE 11.
FIGURE 11.
BRCA1 regulates G-strand overhang length; DSN assays. A–C, T47D cells were treated with the indicated siRNAs or transfected with wild-type BRCA1 or empty pcDNA3 vector, and the genomic DNA was isolated. Aliquots of genomic DNA (5 μg) were treated with DSN, incubated with or without Exo I, electrophoresed on a denaturing polyacrylamide gel containing 8 m urea, transferred to a Brightstar membrane, hybridized to a C-rich digoxigenin-labeled probe, and processed to calculate the mean sizes of overhangs as in the telomere length assays. Values are means ± S.E. of three independent experiments. D, genomic DNA (5 μg) was incubated with or without DSN for 7 min at 65 °C. Digested products were then electrophoresed on a 4% agarose gel and visualized via ethidium bromide staining.

Similar articles

Cited by

References

    1. Morin G. B. (1989) Cell 59, 521–529 - PubMed
    1. Blackburn E. H. (1997) Biochemistry 62, 1196–1201 - PubMed
    1. McEachern M. J., Krauskopf A., Blackburn E. H. (2000) Annu. Rev. Genet. 34, 331–358 - PubMed
    1. Bodnar A. G., Ouellette M., Frolkis M., Holt S. E., Chiu C. P., Morin G. B., Harley C. B., Shay J. W., Lichtsteiner S., Wright W. E. (1998) Science 279, 349–352 - PubMed
    1. Greider C. W. (1999) Cell 97, 419–422 - PubMed

Publication types

MeSH terms