. 2009 Nov 6;105(10):956-64.
doi: 10.1161/CIRCRESAHA.109.198515. Epub 2009 Sep 24.

Role of Ca2+/calmodulin-stimulated cyclic nucleotide phosphodiesterase 1 in mediating cardiomyocyte hypertrophy

Affiliations

Role of Ca2+/calmodulin-stimulated cyclic nucleotide phosphodiesterase 1 in mediating cardiomyocyte hypertrophy

Clint L Miller et al. Circ Res. .

Abstract

Rationale: Cyclic nucleotide phosphodiesterases (PDEs) through the degradation of cGMP play critical roles in maintaining cardiomyocyte homeostasis. Ca(2+)/calmodulin (CaM)-activated cGMP-hydrolyzing PDE1 family may play a pivotal role in balancing intracellular Ca(2+)/CaM and cGMP signaling; however, its function in cardiomyocytes is unknown.

Objective: Herein, we investigate the role of Ca(2+)/CaM-stimulated PDE1 in regulating pathological cardiomyocyte hypertrophy in neonatal and adult rat ventricular myocytes and in the heart in vivo.

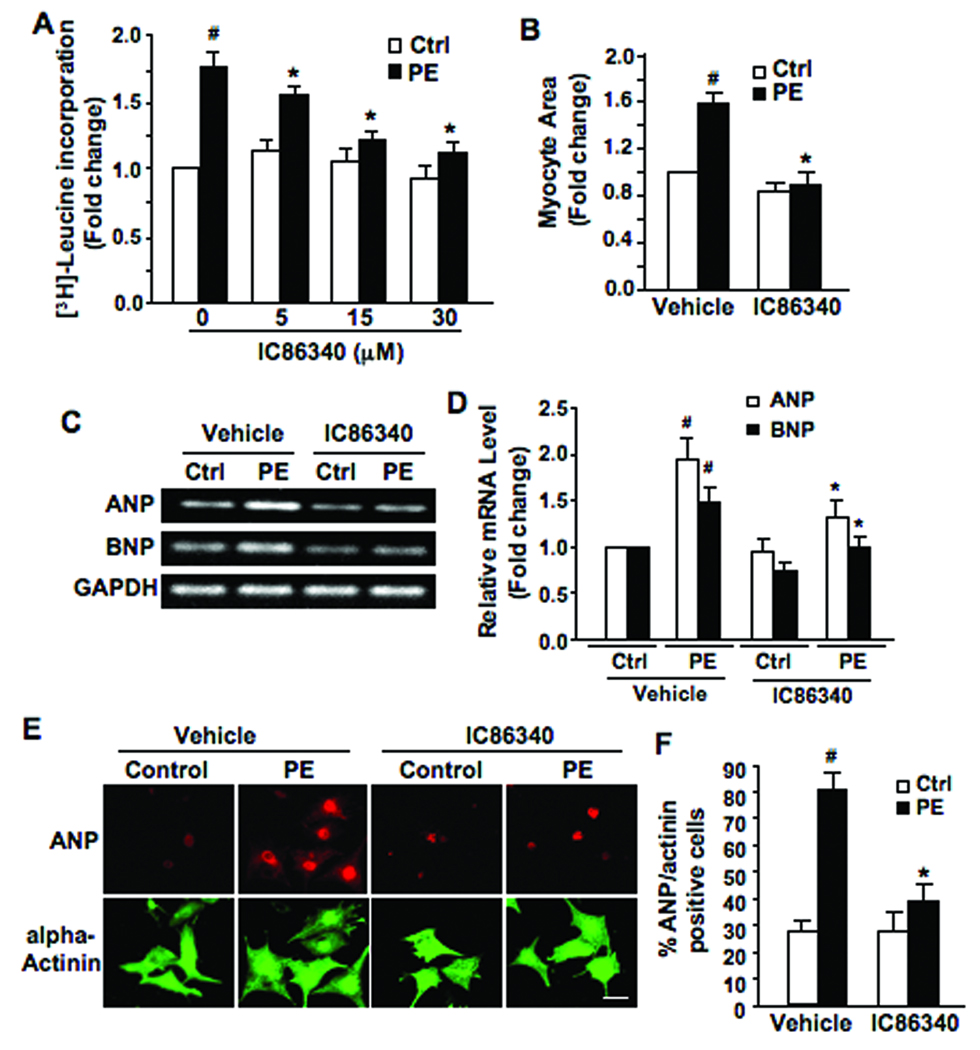
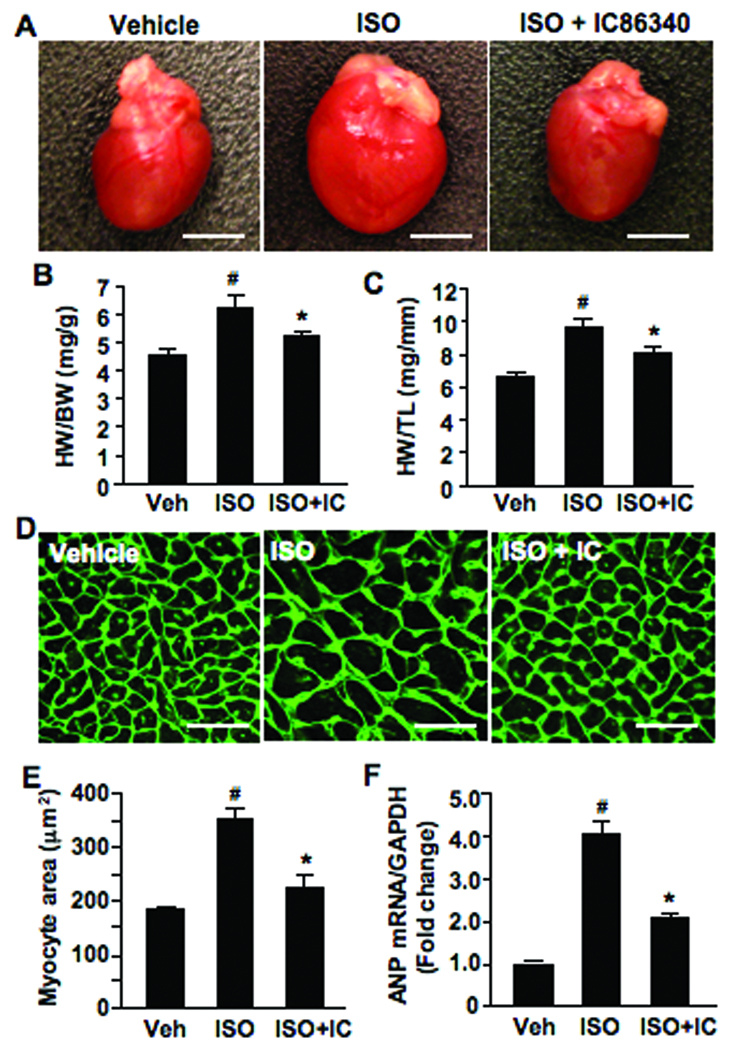
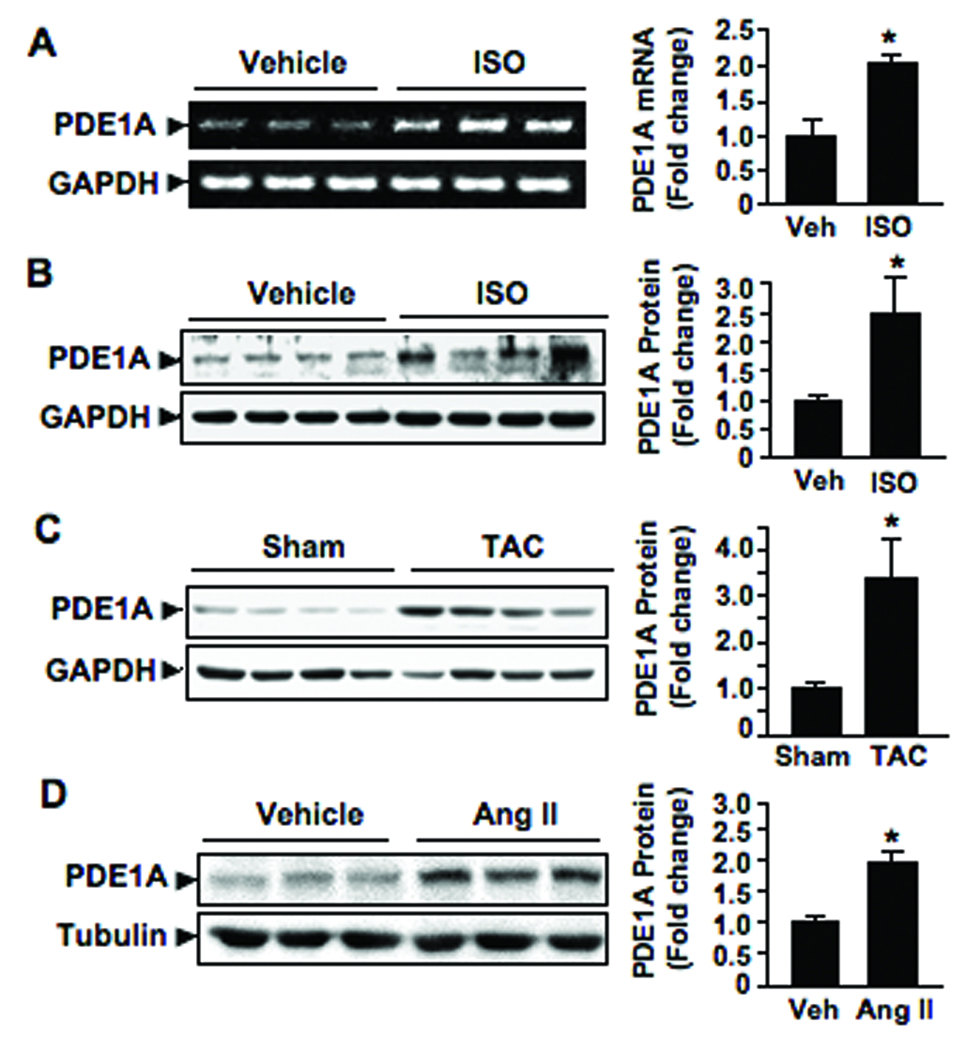
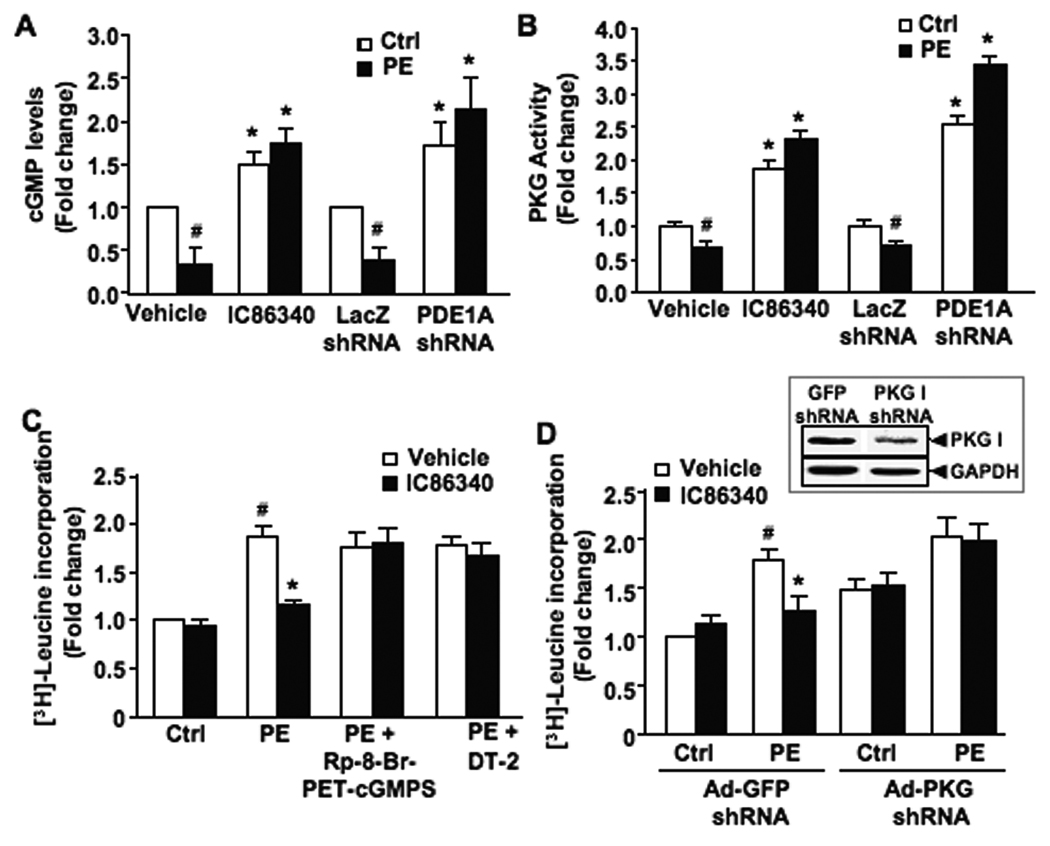
Methods and results: Inhibition of PDE1 activity using a PDE1-selective inhibitor, IC86340, or downregulation of PDE1A using siRNA prevented phenylephrine induced pathological myocyte hypertrophy and hypertrophic marker expression in neonatal and adult rat ventricular myocytes. Importantly, administration of the PDE1 inhibitor IC86340 attenuated cardiac hypertrophy induced by chronic isoproterenol infusion in vivo. Both PDE1A and PDE1C mRNA and protein were detected in human hearts; however, PDE1A expression was conserved in rodent hearts. Moreover, PDE1A expression was significantly upregulated in vivo in the heart and myocytes from various pathological hypertrophy animal models and in vitro in isolated neonatal and adult rat ventricular myocytes treated with neurohumoral stimuli such as angiotensin II (Ang II) and isoproterenol. Furthermore, PDE1A plays a critical role in phenylephrine-induced reduction of intracellular cGMP- and cGMP-dependent protein kinase (PKG) activity and thereby cardiomyocyte hypertrophy in vitro.

Conclusions: These results elucidate a novel role for Ca(2+)/CaM-stimulated PDE1, particularly PDE1A, in regulating pathological cardiomyocyte hypertrophy via a cGMP/PKG-dependent mechanism, thereby demonstrating Ca(2+) and cGMP signaling cross-talk during cardiac hypertrophy.


Figures

Figure 1
Figure 1. Effects of PDE1 inhibitor on pathological NRVM hypertrophy
(A) [3H]-leucine incorporation in NRVM pre-treated with IC86340 (5, 15, or 30 µmol/L) or vehicle for 30 min, followed by PE (50 µmol/L) or vehicle (ctrl) stimulation for 24–48 hours. (B) Total cardiomyocyte surface area was averaged from 100 alpha-actinin immuno-positive cells per condition. Myocytes were pretreated with IC86340 (30 µmol/L) or vehicle, followed by PE (50 µmol/L) or vehicle (ctrl) stimulation for 48 hours. (C) RT-PCR results showing ANP, BNP, skeletal alpha-actin, and GAPDH mRNA in NRVM pretreated with IC86340 (30 µmol/L) or vehicle, followed by PE (50 µmol/L) or vehicle (ctrl) stimulation for 24–48 hours. (D) Quantified RT-PCR results analyzed by densitometry in a linear range, showing the mRNA levels of ANP and BNP relative to GAPDH. (E) Representative micrographs of myocytes treated as abovementioned. Cells were subjected to immunostaining for ANP and sarcomeric alpha-actinin. Scale bar=50 µm. (F) ANP positive cells were measured by cells with perinuclear ANP staining as a percent of total alpha-actinin positive cells. (n=100 cells per condition). Values are mean±SD of triplicates. Data were normalized to sample (vehicle alone) that was arbitrarily set to 1.0. Values are mean±SD of at least three independent experiments performed in triplicates. #p<0.05 vs. vehicle alone, *p<0.05 vs. vehicle+PE.
Figure 2
Figure 2. Effects of PDE1 inhibitor on PE-induced ARVM hypertrophy
(A) Representative bright-field micrographs of myocytes treated with IC86340 (15 µmol/L) or vehicle, followed by PE (10 µmol/L) or vehicle (control) stimulation for 24 hours. (B and C) Changes in mean cell surface areas (B) and width (C) in ARVM pretreated with IC86340 (15 µmol/L), followed by PE (10 µmol/L) or vehicle (ctrl) stimulation for 24 hours. Data represent the average of a minimum of 100 myocytes per condition. (D) [3H]-leucine incorporation in ARVM treated as abovementioned. Data were normalized to the sample (vehicle alone) that was arbitrarily set to 1.0. Values are mean±SD of three independent experiments performed in triplicates. #p<0.05,vs. vehicle alone, *p<0.05 vs. vehicle+PE.
Figure 3
Figure 3. Effects of PDE1 inhibitor on ISO-induced cardiac hypertrophy in vivo
(A) Representative gross heart images showing effects of PDE1 inhibitor on cardiac hypertrophy. Scale bars: 5mm. Animals were infused with vehicle or ISO (30mg/kg/d) for 7 days, and administered vehicle (20% DMSO) or IC86340 (3 mg/kg/d) daily via i.p injection for 10 days (3 days prior and 7 days during ISO infusion). (B) Quantified results of heart weight/ body weight ratio (mg/g). (C) Heart weight/ tibia length ratio (mg/mm). (D) Representative WGA-FITC (green) stained heart sections showing cardiomyocyte cross-sectional area. Scale bars: 25µm. (E) Quantified results of cardiomyocyte cross-sectional area (averaged from 200 random myocytes per section per animal). (F) Hypertrophic marker ANP mRNA expression normalized to GAPDH analyzed by quantitative real-time RT-PCR. Data represent mean±SD from vehicle (n=16), ISO (n=12) and ISO+IC86340 (n=12). #p<0.05,vs. vehicle alone, *p<0.05 vs. vehicle + ISO.
Figure 4
Figure 4. PDE1 mRNA and protein expression in human, rat, and mouse ventricular tissues and isolated cardiomyocytes
(A–C) RT-PCR results showing PDE1A, PDE1B, and PDE1C mRNA expression in adult human, rat, and mouse heart tissue compared to indicated-controls (mouse brain for PDE1A and 1B or mouse testis for PDE1C). RT-PCR data was quantified by densitometry in a linear range from three independent samples, which were normalized to GAPDH mRNA levels and expressed relative to human hearts (AU=arbitrary units). (D) Representative western blot showing relative PDE1A, PDE1B, and PDE1C protein levels in human, rat, and mouse hearts, compared to respective controls (Brain for PDE1A and PDE1B; Testis for PDE1C). GAPDH was used to normalize protein loading. (E and F) PDE1 expression in isolated neonatal and adult cardiomyocytes (NRVM and ARVM). RT-PCR showing relative PDE1A, 1B, and 1C mRNA levels in NRVM, ARVM, and rat hearts, compared to respective controls (E). Western blot depicting relative PDE1A, 1B, and 1C protein levels in NRVM, ARVM, compared to rat hearts and respective controls. GAPDH was used to normalize mRNA and protein expression.
Figure 5
Figure 5. Effects of PDE1A down-regulation on PE-induced cardiomyocyte hypertrophy
(A) Protein synthesis assessed by [3H]-leucine incorporation in NRVM transfected with off-targeting control siRNA or PDE1A siRNA followed by PE (50 µmol/L) or vehicle (ctrl) stimulation for 24 hours. (Inset), Representative blot showing PDE1A protein expression in NRVM transfected with control or PDE1A siRNA. (B) Total cell surface area of cardiomyocytes treated with siRNA as abovementioned. (C) Representative RT-PCR results showing ANP mRNA expression in NRVM treated with siRNA as abovementioned. Data were quantified by densitometry in a linear range and normalized to GAPDH mRNA levels. (D) [3H]-leucine incorporation in NRVM transduced with adenovirus expressing the shRNA targeting LacZ (Ad-LacZ shRNA, as a negative control) or shRNA targeting PDE1A (Ad-PDE1A shRNA), and treated with vehicle, IC86340 (30 µM), or sildenafil (1 µM), followed by PE (50 µmol/L) or vehicle (ctrl) stimulation for 24 hours. (E) [3H]-leucine incorporation in ARVM transduced with adenovirus as abovementioned, followed by PE (50 µmol/L) or vehicle (ctrl) stimulation for 24 hours. (Inset), Representative blot showing PDE1A protein expression in ARVM treated with adenovirus as abovementioned. (F) Total cell surface area of ARVM treated with adenovirus as abovementioned. Data were normalized to the sample (ctrl+control siRNA or shRNA) that was arbitrarily set to 1.0. Values are mean±SD from six (for A) or three (for C) independent experiments performed in triplicate, or triplicates from the same experiment (for D and E, similar results were obtained from at least three independent experiments). The total cell surface areas for (B and F) were averaged from 100 random alpha-actinin immuno-positive cells per condition.
Figure 6
Figure 6. PDE1A expression is upregulated with cardiac hypertrophy both in vivo and in vitro
(A and B) RT-PCR (A) and Western blot (B) showing PDE1A mRNA and protein levels, respectively, in ventricular tissues from mice subjected to vehicle or ISO infusion (30 mg/kg/d) for 7 days. (C and D) Western blot showing PDE1A protein levels in ventricular tissues from mice with pressure overload by TAC or sham operation for 3 weeks (C), or from rats subjected to vehicle or chronic Ang II infusion (0.7 mg/kg/d) for 14 days (D). Bar graphs represent quantitative results of blots analyzed by densitometry, showing PDE1A levels relative to loading controls (GAPDH or Tubulin). Data were normalized to vehicle or control treatment that was arbitrarily set to 1.0. Values are mean±SD (n=3 or 4). *p<0.05 vs. vehicle or control.
Figure 7
Figure 7. PDE1A expression is upregulated in cardiac myocytes during hypertrophy both in vivo and in vitro
(A–C) Immunohistochemistry (IHC) staining demonstrates PDE1A expression in myocardium of mouse hearts with pressure overload by TAC or sham operation for 3 weeks (A), mouse hearts with vehicle or ISO infusion (30mg/kg/day) for 1 week (B), and rat hearts with vehicle or AngII infusion (0.7 mg/kg/day) for 2 week (C). Inset images depict myocyte specific PDE1A immunostaining. (D and E) Western blot showing PDE1A protein expression in isolated NRVM treated with ISO (10 µmol/L) or vehicle (ctrl) for up to 48 hours (D), or in ARVM treated with ISO (1 µmol/L), Ang II (100 nmol/L), or vehicle (ctrl) for 24 hours (E). Bar graphs represent quantitative results of blots analyzed by densitometry within a linear range, showing PDE1A levels relative to GAPDH loading controls. Data were normalized to vehicle or control treatment that was arbitrarily set to 1.0. Values are mean±SD (n=3 independent experiments for in vitro). *p<0.05 vs. vehicle or control.
Figure 8
Figure 8. The effect of PDE1 inhibitor on cardiomyocyte hypertrophy is PKG-dependent
(A) Total cGMP levels measured by radioimmunoassay in NRVM pretreated with IC86340 (15 µmol/L) for 30 minutes or separately transduced with 100 MOI Ad-LacZ or Ad-PDE1A shRNA for 48 hours, followed by PE (50 µmol/L) stimulation for 5 minutes. (B) Net PKG activity (DT-2 inhibited) in NRVM treated as described above. (C) [3H]-leucine incorporation in NRVM pretreated with the PKG inhibitor, Rp-8-Br-PET-cGMPS (50 µmol/L) or DT-2 (250 nmol/L) for 30 minutes, in the presence of IC86340 (30 µmol/L) or vehicle, followed by PE (50 µmol/L) or vehicle (ctrl) stimulation for 48 hours. (D) Protein synthesis assessed via [3H]-leucine incorporation in NRVM transduced with 100 MOI Ad-PKG shRNA or Ad-GFP shRNA. (Inset) Representative blot showing PKG I protein expression in NRVM treated as described. Data were normalized to the sample (with vehicle or GFP-shRNA alone) that was arbitrarily set to 1.0. Values are mean±SD of at least three independent experiments performed in triplicates for A, C, and D, or triplicates in the same experiment for B (similar observations confirmed by two independent experiments). #p<0.05 vs. vehicle or control, *p<0.05 vs. vehicle+PE.

Comment in

References

    1. Bers DM. Calcium cycling and signaling in cardiac myocytes. Annu Rev Physiol. 2008;70:23–49. - PubMed
    1. Hardt SE, Sadoshima J. Negative regulators of cardiac hypertrophy. Cardiovasc Res. 2004;63(3):500–509. - PubMed
    1. Zahabi A, Picard S, Fortin N, Reudelhuber TL, Deschepper CF. Expression of constitutively active guanylate cyclase in cardiomyocytes inhibits the hypertrophic effects of isoproterenol and aortic constriction on mouse hearts. J Biol Chem. 2003;278(48):47694–47699. - PubMed
    1. Holtwick R, van Eickels M, Skryabin BV, Baba HA, Bubikat A, Begrow F, Schneider MD, Garbers DL, Kuhn M. Pressure-independent cardiac hypertrophy in mice with cardiomyocyte-restricted inactivation of the atrial natriuretic peptide receptor guanylyl cyclase-A. J Clin Invest. 2003;111(9):1399–1407. - PMC - PubMed
    1. Takimoto E, Champion HC, Li M, Belardi D, Ren S, Rodriguez ER, Bedja D, Gabrielson KL, Wang Y, Kass DA. Chronic inhibition of cyclic GMP phosphodiesterase 5A prevents and reverses cardiac hypertrophy. Nat Med. 2005;11(2):214–222. - PubMed

Publication types

MeSH terms