

The calcium-sensing receptor (CaSR) defends against hypercalcemia independently of its regulation of parathyroid hormone secretion
- PMID: 19797241
- PMCID: PMC2763782
- DOI: 10.1152/ajpendo.00315.2009
The calcium-sensing receptor (CaSR) defends against hypercalcemia independently of its regulation of parathyroid hormone secretion
Abstract
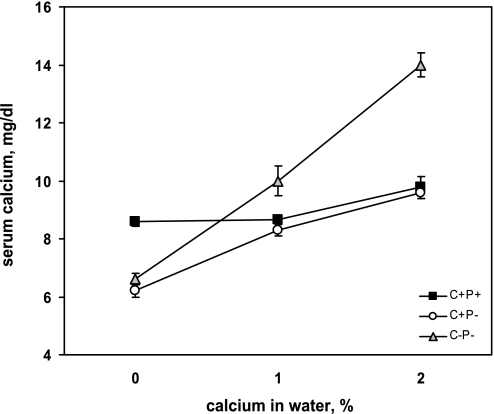
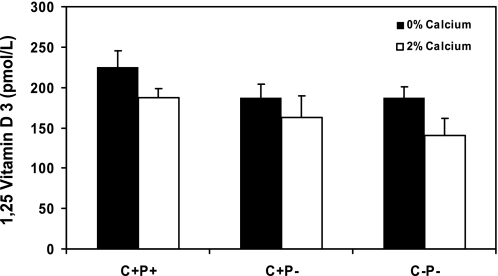
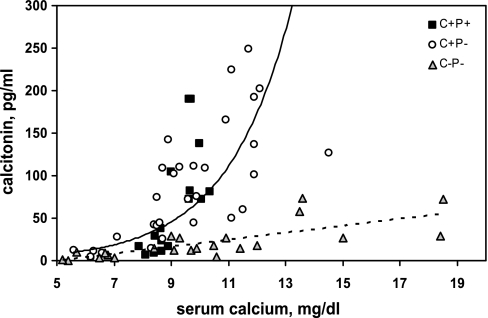
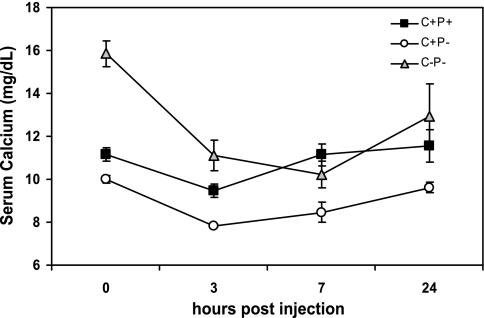
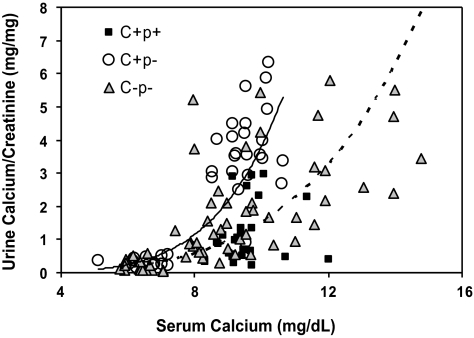
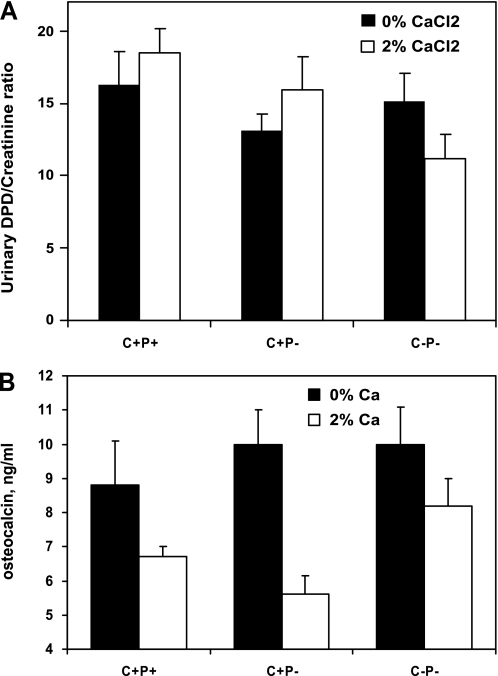
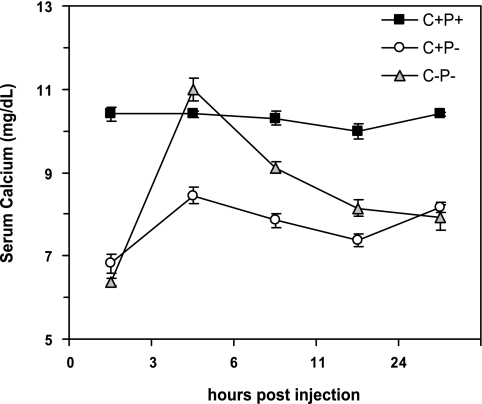
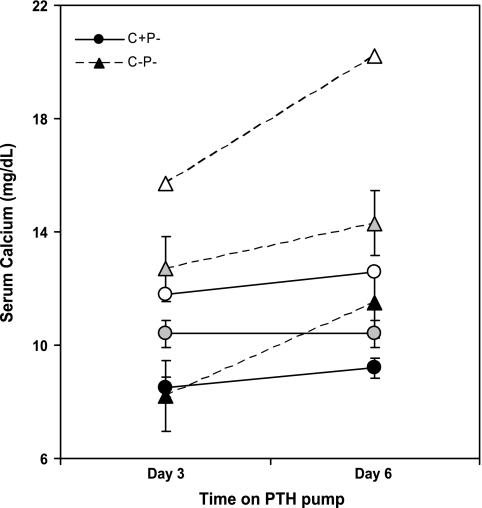
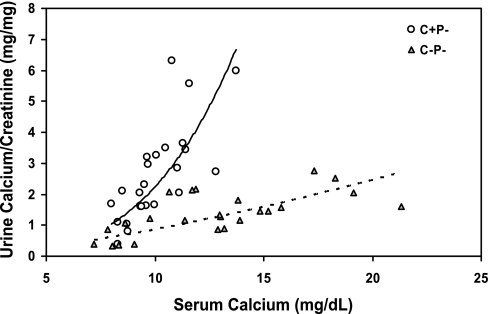
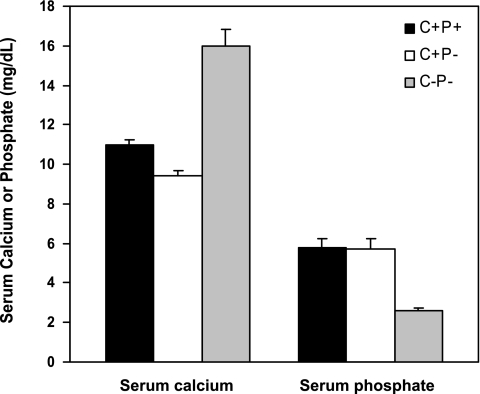
The calcium-sensing receptor (CaSR) controls parathyroid hormone (PTH) secretion, which, in turn, via direct and indirect actions on kidney, bone, and intestine, maintains a normal extracellular ionized calcium concentration (Ca(2+)(o)). There is less understanding of the CaSR's homeostatic importance outside of the parathyroid gland. We have employed single and double knockout mouse models, namely mice lacking PTH alone (CaSR(+/+) PTH(-/-), referred to as C(+)P(-)), lacking both CaSR and PTH (CaSR(-/-) PTH(-/-), C(-)P(-)) or wild-type (CaSR(+/+) PTH(+/+), C(+)P(+)) mice to study CaSR-specific functions without confounding CaSR-mediated changes in PTH. The mice received three hypercalcemic challenges: an oral Ca(2+) load, injection or constant infusion of PTH via osmotic pump, or a phosphate-deficient diet. C(-)P(-) mice show increased susceptibility to developing hypercalcemia with all three challenges compared with the other two genotypes, whereas C(+)P(-) mice defend against hypercalcemia similarly to C(+)P(+) mice. Reduced renal Ca(2+) clearance contributes to the intolerance of the C(-)P(-) mice to Ca(2+) loads, as they excrete less Ca(2+) at any given Ca(2+)(o) than the other two genotypes, confirming the CaSR's direct role in regulating renal Ca(2+) handling. In addition, C(+)P(+) and C(+)P(-), but not C(-)P(-), mice showed increases in serum calcitonin (CT) levels during hypercalcemia. The level of 1,25(OH)(2)D(3) in C(-)P(-) mice, in contrast, was similar to those in C(+)P(-) and C(+)P(+) mice during an oral Ca(2+) load, indicating that increased 1,25(OH)(2)D(3) production cannot account for the oral Ca(2+)-induced hypercalcemia in the C(-)P(-) mice. Thus, CaSR-stimulated PTH release serves as a "floor" to defend against hypocalcemia. In contrast, high-Ca(2+)(o)-induced inhibition of PTH is not required for a robust defense against hypercalcemia, at least in mice, whereas high-Ca(2+)(o)-stimulated, CaSR-mediated CT secretion and renal Ca(2+) excretion, and perhaps other factors, serve as a "ceiling" to limit hypercalcemia resulting from various types of hypercalcemic challenges.
Figures
Similar articles
-
The full-length calcium-sensing receptor dampens the calcemic response to 1alpha,25(OH)2 vitamin D3 in vivo independently of parathyroid hormone.Am J Physiol Renal Physiol. 2009 Sep;297(3):F720-8. doi: 10.1152/ajprenal.00164.2009. Epub 2009 May 27. Am J Physiol Renal Physiol. 2009. PMID: 19474191 Free PMC article.
-
CaSR-mediated interactions between calcium and magnesium homeostasis in mice.Am J Physiol Endocrinol Metab. 2013 Apr 1;304(7):E724-33. doi: 10.1152/ajpendo.00557.2012. Epub 2013 Jan 29. Am J Physiol Endocrinol Metab. 2013. PMID: 23360827 Free PMC article.
-
A novel mouse model for familial hypocalciuric hypercalcemia (FHH1) reveals PTH-dependent and independent CaSR defects.Pflugers Arch. 2024 May;476(5):833-845. doi: 10.1007/s00424-024-02927-y. Epub 2024 Feb 22. Pflugers Arch. 2024. PMID: 38386045 Free PMC article.
-
Control of renal calcium, phosphate, electrolyte, and water excretion by the calcium-sensing receptor.Best Pract Res Clin Endocrinol Metab. 2013 Jun;27(3):345-58. doi: 10.1016/j.beem.2013.04.009. Epub 2013 May 15. Best Pract Res Clin Endocrinol Metab. 2013. PMID: 23856264 Review.
-
1alpha(OH)D3 One-alpha-hydroxy-cholecalciferol--an active vitamin D analog. Clinical studies on prophylaxis and treatment of secondary hyperparathyroidism in uremic patients on chronic dialysis.Dan Med Bull. 2008 Nov;55(4):186-210. Dan Med Bull. 2008. PMID: 19232159 Review.
Cited by
-
Engendering biased signalling from the calcium-sensing receptor for the pharmacotherapy of diverse disorders.Br J Pharmacol. 2014 Mar;171(5):1142-55. doi: 10.1111/bph.12420. Br J Pharmacol. 2014. PMID: 24111791 Free PMC article. Review.
-
Biased allosteric modulation at the CaS receptor engendered by structurally diverse calcimimetics.Br J Pharmacol. 2015 Jan;172(1):185-200. doi: 10.1111/bph.12937. Epub 2014 Dec 1. Br J Pharmacol. 2015. PMID: 25220431 Free PMC article.
-
Autosomal Dominant Hypocalcemia (Hypoparathyroidism) Types 1 and 2.Front Physiol. 2016 Oct 18;7:458. doi: 10.3389/fphys.2016.00458. eCollection 2016. Front Physiol. 2016. PMID: 27803672 Free PMC article. Review.
-
Calcium Oxalate Induces Renal Injury through Calcium-Sensing Receptor.Oxid Med Cell Longev. 2016;2016:5203801. doi: 10.1155/2016/5203801. Epub 2016 Nov 14. Oxid Med Cell Longev. 2016. PMID: 27965733 Free PMC article.
-
Parathyroid hormone ablation alters erythrocyte parameters that are rescued by calcium-sensing receptor gene deletion.Eur J Haematol. 2013 Jul;91(1):37-45. doi: 10.1111/ejh.12110. Epub 2013 Apr 27. Eur J Haematol. 2013. PMID: 23528155 Free PMC article.
References
-
- Ba J, Friedman PA. Calcium-sensing receptor regulation of renal mineral ion transport. Cell Calcium 35: 229–237, 2004 - PubMed
-
- Breslau N, Moses AM, Weiner IM. The role of volume contraction in the hypocalciuric action of chlorothiazide. Kidney Int 10: 164–170, 1976 - PubMed
-
- Bringhurst FR, Demay MB, Kronenberg HM. Hormones, and disorders of mineral metabolism. In: Williams Textbook of Endocrinology (9th ed.), edited by Wilson JD, Foster DW, Kronenberg HM, Larsen PR. Philadelphia, PA: WB Saunders, 1998, p. 1155–1209
-
- Brown EM. Clinical lessons from the calcium-sensing receptor. Nat Clin Pract Endocrinol Metab 3: 122–133, 2007 - PubMed
Publication types
MeSH terms
Substances
Grants and funding
LinkOut - more resources
Full Text Sources
Molecular Biology Databases
Miscellaneous