Comparative Study
. 2009 Nov 26;114(23):4886-96.
doi: 10.1182/blood-2009-06-228940. Epub 2009 Oct 1.

Contributions of extravascular and intravascular cells to fibrin network formation, structure, and stability

Affiliations
Comparative Study

Contributions of extravascular and intravascular cells to fibrin network formation, structure, and stability

Robert A Campbell et al. Blood. .

Abstract

Fibrin is essential for hemostasis; however, abnormal fibrin formation is hypothesized to increase thrombotic risk. We previously showed that in situ thrombin generation on a cell's surface modulates the 3-dimensional structure and stability of the fibrin network. Currently, we compared the abilities of extravascular and intravascular cells to support fibrin formation, structure, and stability. Extravascular cells (fibroblasts, smooth muscle) supported formation of dense fibrin networks that resisted fibrinolysis, whereas unstimulated intravascular (endothelial) cells produced coarse networks that were susceptible to fibrinolysis. All 3 cell types produced a fibrin structural gradient, with a denser network near, versus distal to, the cell surface. Although fibrin structure depended on cellular procoagulant activity, it did not reflect interactions between integrins and fibrin. These findings contrasted with those on platelets, which influenced fibrin structure via interactions between beta3 integrins and fibrin. Inflammatory cytokines that induced prothrombotic activity on endothelial cells caused the production of abnormally dense fibrin networks that resisted fibrinolysis. Blocking tissue factor activity significantly reduced the density and stability of fibrin networks produced by cytokine-stimulated endothelial cells. Together, these findings indicate fibrin structure and stability reflect the procoagulant phenotype of the endogenous cells, and suggest abnormal fibrin structure is a novel link between inflammation and thrombosis.


Figures
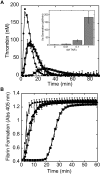
Figure 1
Figure 1
Extravascular and intravascular cells support different levels of thrombin generation and fibrin formation. Recalcified (10mM, final) normal, pooled PFP was added to confluent cell monolayers. (A) Thrombin generation was measured using calibrated automated thrombography; data (± SD) shown are averaged from at least 5 separate experiments. (A inset) HUVECs were incubated with TNFα (0-1nM) for 4 hours at 37°C. Factor Xa generation (± SD) was measured by incubating cells with factors VIIa and X in the presence of CaCl2, and measuring factor Xa generation by chromogenic substrate in 2 separate experiments. (B) Fibrin polymerization was measured by turbidity at 405 nm; data (± SD) shown are from 1 experiment, representative of at least 7 independent experiments. Symbols for panels A and B are as follows: fibroblasts, (●); SMCs, (♦); HUVECs, (■); and HUVECs stimulated with TNFα for 4 hours, (▴).
Figure 2
Figure 2
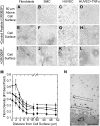
In situ thrombin generation on the cell surface modulates clot architecture in 3 dimensions. Clots were formed by incubating cells with recalcified normal, pooled PFP in the presence of 500μM (final) control peptide GRGESP (A-H) or GRGDSP (I-L). Three-dimensional projections show clot architecture in 10-μm stacks at (E-L) and above (A-D) the cell surface. Each image (146 μm × 146 μm, xy) is from 1 experiment, representative of at least 3 independent experiments. Darker areas show increased fibrin density. (M) Fibrin network density (± SD) of clots produced by fibroblasts (●), SMCs (♦), HUVECs (■), and TNFα-stimulated HUVECs (▴) was determined as described in “Methods” from at least 3 independent experiments. (N) Clots were formed in excised human saphenous vein segments as described in “Structural analysis of ex vivo clots by transmission electron microscopy.” Clots were then fixed, examined by transmission electron microscopy, and fibrin fibers (black dots) were quantified at (0 μm) and above (5 μm) from the cell surface (indicated by black rectangles). Original magnification, × 2000; bar represents 5 μm. The image is representative of 3 independent experiments.
Figure 3
Figure 3
β 3 integrins do not modulate fibrin structure on fibroblasts, SMCs, or HUVECs. In situ thrombin generation was initiated by incubating fibroblasts, SMCs, and HUVECs with recalcified, normal, pooled PFP in the presence of 0.136μM control IgG or anti-β3 antibody (abciximab) as described in “Methods.” Three-dimensional projections show clot architecture in 10-μm stacks 0 to 10 μm from the cell surface. Each image (146 μm × 146 μm, xy) is from 1 experiment, representative of 2 to 5 separate experiments. Data (no. fibers/point, ± SD) indicate mean fibrin network density from all experiments. Fibrin density in clots formed in the presence of control IgG or abciximab was not statistically different.
Figure 4
Figure 4
β 3 integrins modulate fibrin structure on platelets. (A,C) Clotting was initiated on platelets with the addition of recalcified, normal, pooled PFP to lipidated TF (1:120 000, final), in the presence of 0.136μM control IgG (A) or the anti-b3 Fab abciximab (C). (B,D) Clotting was initiated on platelets with the addition of fibrinogen, calcium, and thrombin (2 mg/mL, 5mM, and 2nM, respectively), in the presence of 0.136μM control IgG (B) or abciximab (D). Three-dimensional projections (146 μm × 146 μm, xy) show clot architecture in 10-μm stacks at 0 to 10 μm from the cell surface. Each image is from 1 experiment, representative of 4 independent experiments. Darker areas show increased fibrin density. Arrows in panels A and B indicate increased fibrin density surrounding individual platelets. (E) Data (± SD) indicate mean fibrin network density from all experiments. *P < .004 versus corresponding control IgG
Figure 5
Figure 5
In situ thrombin generation influences clot stability. Clots were formed by incubating cells with recalcified normal, pooled PFP in the presence of tPA (250 ng/mL) and clot formation and lysis were monitored by an increase and subsequent decrease in turbidity at 405 nm. All values for (A) time to peak and (B) peak turbidity (± SD) were statistically different (*P < .05) compared with HUVECs.
Figure 6
Figure 6
Fibrin network density correlates with cellular expression of TF activity. Factor Xa generation (○, A), prothrombinase activity (●, B), and fibrin density (x-axis) were measured in reactions with HUVECs, SMCs, TNFα-stimulated HUVECs, and fibroblasts (left to right) as described in “TF, prothrombinase activity, and activated protein C generation assays.”
Figure 7
Figure 7
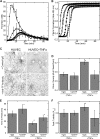
TF inhibition prolongs the onset and reduces the rate of thrombin generation and clot formation, resulting in a less dense fibrin network. Recalcified (10mM, final) normal pooled PFP was added to confluent HUVECs and TNFα-treated HUVEC monolayers in the presence of anti-TF antibody (10 μg/mL anti–human TF antibody) or IgG control. (A) Thrombin generation was measured by calibrated automated thrombography. Data (± SD) show the average of 5 separate experiments. (B) Fibrin polymerization was monitored by turbidity at 405 nm. Data (± SD) shown are from 1 experiment, representative of 4 separate experiments. Symbols for panels A and B are HUVECs plus: IgG, (■); anti-TF, (□); TNFα+IgG, (▴); TNFα+anti-TF, (▵). (C) Three-dimensional projections (146 μm × 146 μm, xy) show clot architecture in 10-μm stacks 0 to 10 μm from the surface of unstimulated or TNFα-stimulated HUVECs in the presence or absence of anti-TF, as indicated. Each image is from 1 experiment, representative of 4 independent experiments. (D) Fibrin density (± SD) was measured as described in “Methods.” (E-F) Clotting was initiated in the presence of tPA (250 ng/mL) and the time to peak and peak turbidity were calculated from resulting turbidity curves. Data (± SD) show the average of 9 independent experiments. *P < .05 versus unstimulated HUVECs.

References

    1. Lisman T, de Groot PG, Meijers JC, Rosendaal FR. Reduced plasma fibrinolytic potential is a risk factor for venous thrombosis. Blood. 2005;105(3):1102–1105. - PubMed
    1. Collet JP, Allali Y, Lesty C, et al. Altered fibrin architecture is associated with hypofibrinolysis and premature coronary atherothrombosis. Arterioscler Thromb Vasc Biol. 2006;26(11):2567–2573. - PubMed
    1. Blombäck B, Carlsson K, Hessel B, Liljeborg A, Procyk R, Aslund N. Native fibrin gel networks observed by 3D microscopy, permeation and turbidity. Biochim Biophys Acta. 1989;997(1-2):96–110. - PubMed
    1. Wolberg AS, Allen GA, Monroe DM, Hedner U, Roberts HR, Hoffman M. High dose factor VIIa improves clot structure and stability in a model of haemophilia B. Br J Haematol. 2005;131(5):645–655. - PubMed
    1. Collet JP, Park D, Lesty C, et al. Influence of fibrin network conformation and fibrin fiber diameter on fibrinolysis speed: dynamic and structural approaches by confocal microscopy. Arterioscler Thromb Vasc Biol. 2000;20(5):1354–1361. - PubMed

Publication types

MeSH terms