. 2009 Oct 2;326(5949):144-7.
doi: 10.1126/science.1175145.

Genome-wide RNAi screen identifies Letm1 as a mitochondrial Ca2+/H+ antiporter

Affiliations

Genome-wide RNAi screen identifies Letm1 as a mitochondrial Ca2+/H+ antiporter

Dawei Jiang et al. Science. .

Abstract

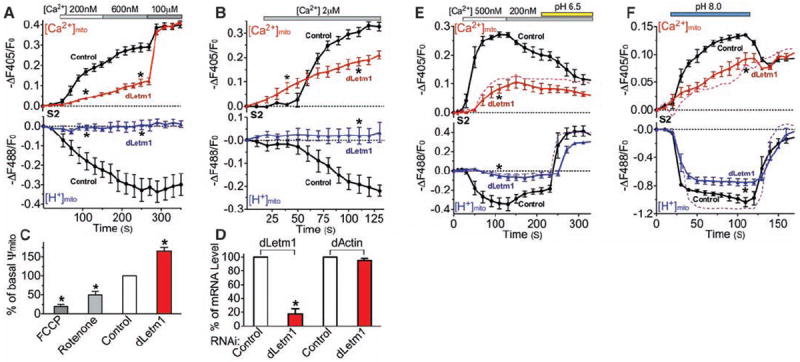
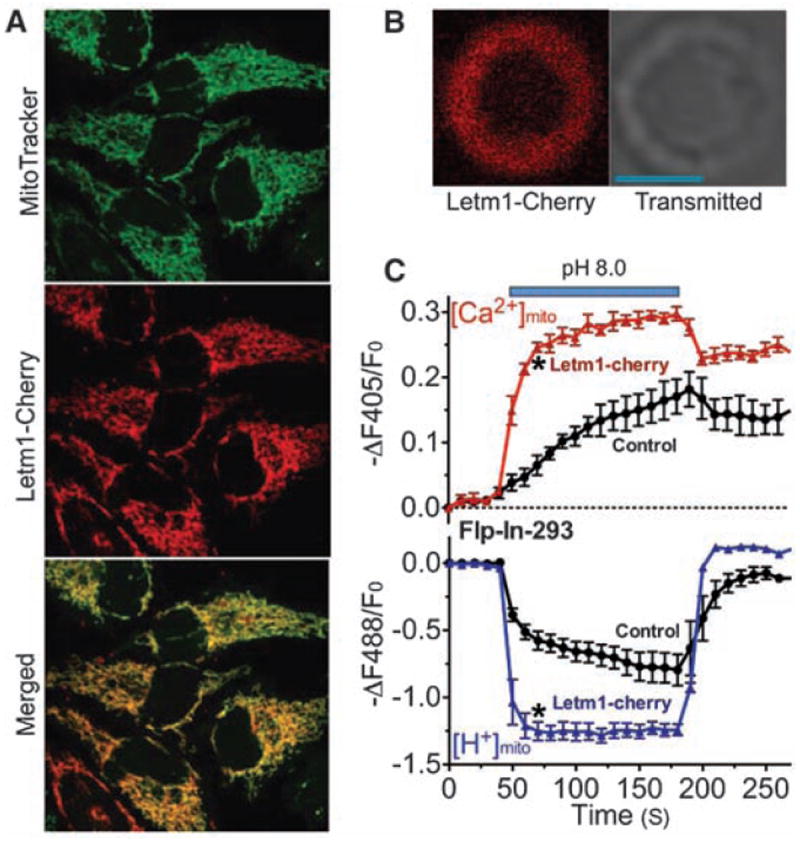
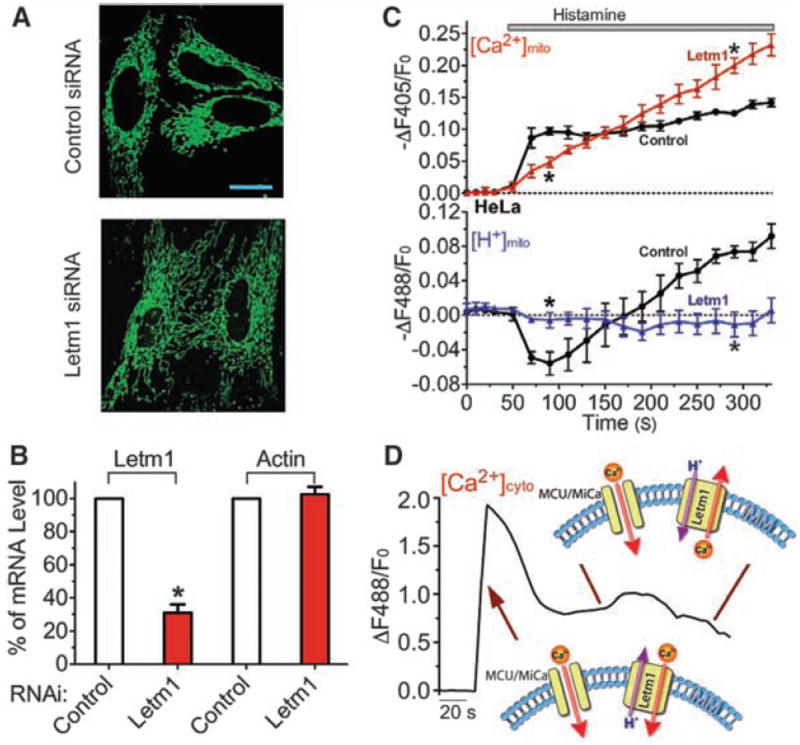
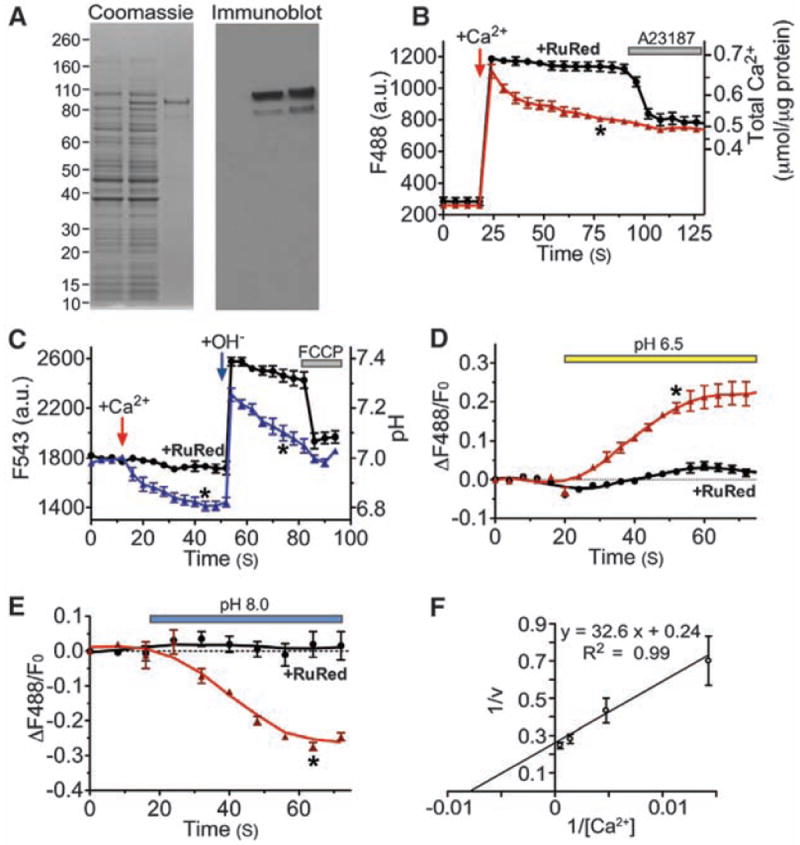
Mitochondria are integral components of cellular calcium (Ca2+) signaling. Calcium stimulates mitochondrial adenosine 5'-triphosphate production, but can also initiate apoptosis. In turn, cytoplasmic Ca2+ concentrations are regulated by mitochondria. Although several transporter and ion-channel mechanisms have been measured in mitochondria, the molecules that govern Ca2+ movement across the inner mitochondrial membrane are unknown. We searched for genes that regulate mitochondrial Ca2+ and H+ concentrations using a genome-wide Drosophila RNA interference (RNAi) screen. The mammalian homolog of one Drosophila gene identified in the screen, Letm1, was found to specifically mediate coupled Ca2+/H+ exchange. RNAi knockdown, overexpression, and liposome reconstitution of the purified Letm1 protein demonstrate that Letm1 is a mitochondrial Ca2+/H+ antiporter.


Figures

Fig. 1
Fig. 1
dLetm1 knockdown reduces Ca2+/H+ antiport. (A) [Ca2+]mito (upper panel) and [H+]mito (lower panel) measurements in digitonin-permeabilized S2-pericam cells treated with scrambled control (circles; n = 6, 194 cells) or dLetm1 dsRNAs (triangles; n = 6, 167 cells). (B) Experiment as in (A), but with 2 μMCa2+ applied to cells treated with scrambled control (circles; n = 4, 93 cells) or dLetm1 dsRNAs (triangles; n = 4, 81 cells). (C) Transmitochondrial voltage (Ψmito; measured with 5 nM TMRM) in control S2-pericam cells was reduced by the ETC inhibitors rotenone and antimycin (5 μM, n = 3, 81 cells) or by the protonophore trifluoromethoxy carbonyl cyanide phenylhydrazone (FCCP; 10 μM, n = 3, 102 cells). By contrast, Ψmito was increased in dLetm1 knockdown cells (n = 3, 113 cells) as compared to cells treated with scrambled control dsRNA (n = 3, 168 cells). (D) Relative mRNA level of dLetm1 and actin in control and dLetm1 dsRNA-treated S2 cells by quantitative reverse transcription–polymerase chain reaction (RT-PCR) (n =3). (E) Ca2+- and pH gradient–driven [Ca2+]mito and [H+]mito changes in permeabilized S2-pericam cells treated with control (circles; n = 4, 143 cells) or dLetm1 dsRNAs (triangles; n = 4, 113 cells). A representative trace shows the effect of applying the H+/K+ antiporter nigericin (1 μM, dashed colored line) on dLetm1 dsRNA-treated cells (n = 3, 87 cells). (F) pH-dependent [Ca2+]mito and [H+]mito changes in permeabilized S2-pericam cells treated with scrambled control (circles; n = 6, 214 cells) or dLetm1 dsRNAs (triangles; n = 6, 187 cells). BAPTA-maintained test solution [Ca2+] = 50 nM. A representative trace shows the effect of nigericin (1 μM, dotted line) on dLetm1 dsRNA-treated cells (n = 3, 104 cells). All data shown are the mean ± SEM (*P < 0.05, two-tailed Student’s t test).
Fig. 2
Fig. 2
Letm1 overexpression enhances Ca2+/H+ antiport. (A) Letm1 is localized to mitochondria. Representative images of Flp-In-293-pericam cells transfected with Letm1-Cherry and loaded with 10 nM MitoTracker green. (B) Representative image of a Letm1-Cherry–labeled mitoplast; Letm1-Cherry was targeted to the mitochondrial inner membrane. Scale bar: 2 μm. (C) Alkaline pH (pH 8.0) increased [Ca2+]mito and decreased [H+]mito in digitonin-permeabilized Flp-In-293-pericam cells in vector controls (circles; n = 5, 119 cells). Overexpression of Letm1-Cherry (triangles; n = 5, 93 cells) enhanced these changes. [Ca2+]o = 250 nM. Data shown are the mean ± SEM (*P < 0.05, two-tailed Student’s t test).
Fig. 3
Fig. 3
Letm1 knockdown disrupts Ca2+/H+ antiport in intact cells. (A) mt-Pericam–labeled mitochondria appear grossly normal in a representative image of Letm1 siRNA-treated HeLa cells compared to cells treated with scrambled control siRNA. Scale bar: 20 μm. (B) Determination of the mRNA level of Letm1 and actin in control and Letm1 siRNA-treated HeLa cells by quantitative RT-PCR (n = 3). (C) Letm1 knockdown disturbs normal mitochondrial [Ca2+]mito and [H+]mito regulation in H1R-expressing HeLa cells. Histamine was applied to stimulate an increase in cytoplasmic [Ca2+] in cells in [Ca2+]o = 2 mM treated with control (circles; n = 8, 76 cells) or Letm1 siRNAs (triangles; n = 6, 47 cells). Two independent Letm1 siRNAs were used to confirm the result. (D) Representative trace of the [Ca2+]cyto changes in HeLa cells upon histamine stimulation, and model of the roles of MCU/MiCa and Letm1 Ca2+/H+ exchanger activity under these conditions (arrows indicate their actions during the trace). All data shown are the mean ± SEM (*P < 0.05, two-tailed Student’s t test).
Fig. 4
Fig. 4
Purified Letm1 reconstitutes Ca2+ transport in liposomes. (A) Letm1 protein stained by Coomassie blue (left) and antibody to His-Letm1 (right). Left lane, total bacterial cell lysate from control; middle lanes, Letm1-His–expressing bacteria; right lanes, isolated Letm1-His proteins. The band migrating at ~83 kD is consistent with Letm1’s predicted molecular size. (B) Ca2+ addition initially increased external Ca2+, followed by Ca2+ import as indicated by decreasing fluorescence (triangles; n = 8). Ca2+ uptake was blocked by Ruthenium red (RuR; 10 nmol/μg; circles; n = 5), which was reversed by the Ca2+ ionophore, A23187 (5 μM). Liposomes occupied ~30% of the total volume based on the maximum Ca2+ uptake triggered by 4-Bromo-A23187. No leak was detected in liposomes without Letm1. (C) Ca2+-driven H+ efflux in Letm1 proteoliposomes. Addition of 100 μM Ca2+ triggered H+ efflux; application of 100 μM CsOH transiently increased the external pH, followed by a rapid decline in pH (triangles; n = 5), which was blocked by RuR (10 nmol/μg; circles; n = 3). Finally, FCCP (10 μM, protonophore) reduced the external pH to basal levels. (D and E) pH-driven Ca2+ uptake in Letm1 proteoliposomes; Ca2+ release or uptake in Letm1 proteoliposomes was blocked by RuR. No-added-RuR, triangles, n = 4; 10 nmol/μg RuR, circles, n = 3. (F) The inverse Ca2+ transport velocity (1/v; nmol/μg protein per second) was plotted against inverse total added [Ca2+] (nmol/μg protein, n = 3 to 8) in this double reciprocal plot to calculate Km (137 nmol Ca2+/μg protein) and Vmax (4.2 nmol/μg protein per second) using Michaelis-Menten assumptions (24). All data shown are the mean ± SEM (*P < 0.05 in a two-tailed Student’s t test).

Comment in

References

    1. Rizzuto R, Bernardi P, Pozzan T. J Physiol. 2000;529:37. - PMC - PubMed
    1. Kirichok Y, Krapivinsky G, Clapham DE. Nature. 2004;427:360. - PubMed
    1. Gunter KK, Gunter TE. J Bioenerg Biomembr. 1994;26:471. - PubMed
    1. Bernardi P. Physiol Rev. 1999;79:1127. - PubMed
    1. Demaurex N, Poburko D, Frieden M. Biochim Biophys Acta. 2009;1787:1383. - PubMed

Publication types

MeSH terms