. 2009 Oct 2;326(5949):147-50.
doi: 10.1126/science.1175241.

Dissecting the genetic basis of resistance to malaria parasites in Anopheles gambiae

Affiliations

Dissecting the genetic basis of resistance to malaria parasites in Anopheles gambiae

Stephanie A Blandin et al. Science. .

Abstract

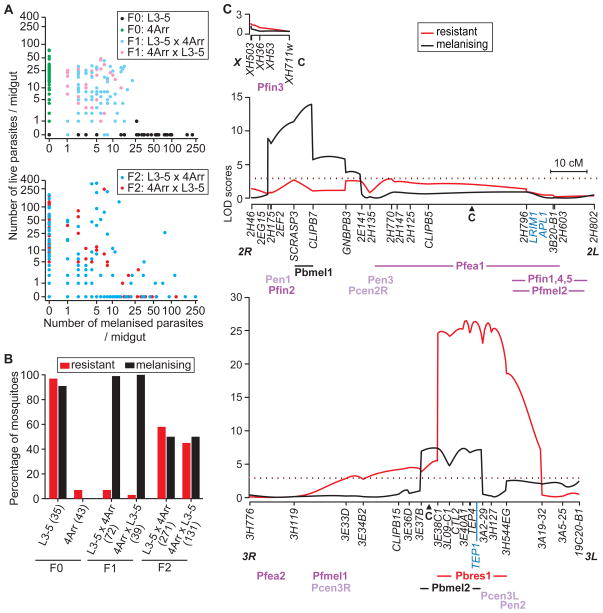
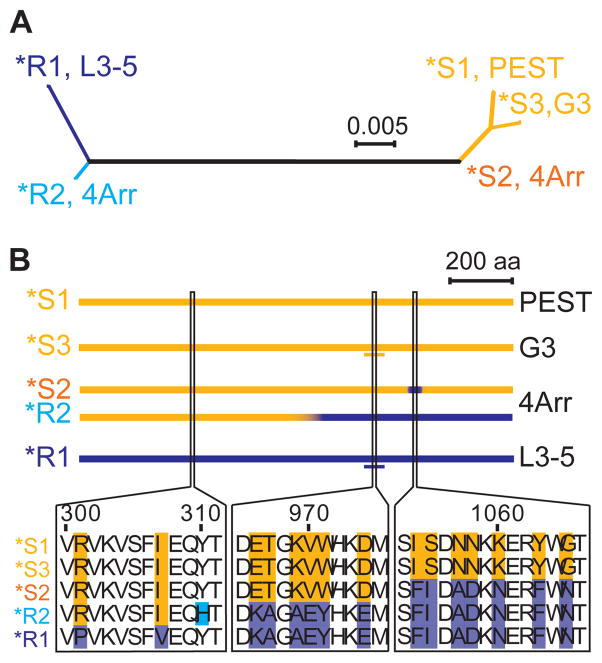
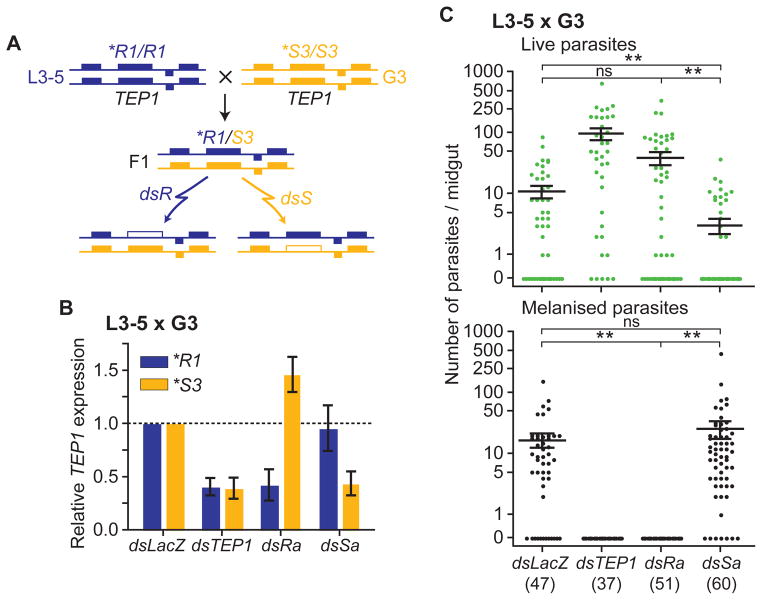
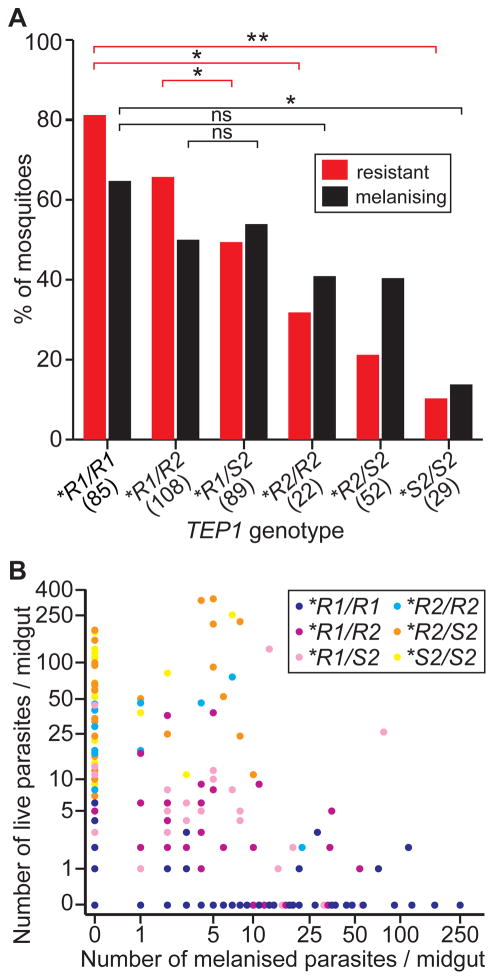
The ability of Anopheles gambiae mosquitoes to transmit Plasmodium parasites is highly variable between individuals. However, the genetic basis of this variability has remained unknown. We combined genome-wide mapping and reciprocal allele-specific RNA interference (rasRNAi) to identify the genomic locus that confers resistance to malaria parasites and demonstrated that polymorphisms in a single gene encoding the antiparasitic thioester-containing protein 1 (TEP1) explain a substantial part of the variability in parasite killing. The link between TEP1 alleles and resistance to malaria may offer new tools for controlling malaria transmission. The successful application of rasRNAi in Anopheles suggests that it could also be applied to other organisms where RNAi is feasible to dissect complex phenotypes to the level of individual quantitative trait alleles.


Figures

Fig. 1
Fig. 1
Loci associated with resistance and clearance of dead parasites. (A) Numbers of melanised (x-axis) and live (y-axis) parasites per mosquito in reciprocal crosses of the resistant L3-5 and susceptible 4Arr strains. (B) Percentages of resistant (devoid of live parasites) and melanising (bearing at least one melanised parasite) mosquitoes in each generation. (C) Linkage mapping for the resistant (red) and melanising (black) traits, with estimated LOD score thresholds represented as dotted lines (3.00 and 2.88, respectively). Genetic markers, centromere positions (C), chromosome arms and the TEP1, LRIM1 and APL1 loci (in cyan) are indicated below axes. Previously identified QTLs for resistance against simian parasites (light purple) or P. falciparum (dark purple) are positioned below chromosomes. The PRI corresponds to the region covered by the QTLs Pfin1, Pfin4, Pfin5 and Pfmel2.
Fig. 2
Fig. 2
TEP1 polymorphism. (A) Phylogenetic tree built from the global alignment of complete amino acid sequences of TEP1 alleles from L3-5 (*R1), 4Arr (*R2 and *S2) and G3 (*S3) mosquitoes and the previously described *S1 allele from the PEST strain. Scale bar: estimated amino acid substitutions per site. (B) Schematic representation of TEP1 sequences. Amino-acid sequences of *S1 and *S3 are represented by orange horizontal bars, *R1 by a blue bar. The 4Arr alleles are combinations of *S1/S3 and *R1, as illustrated by short stretches of aligned sequences. The short horizontal lines below *R1 and *S3 indicate the regions targeted by dsRa and dsSa, respectively.
Fig. 3
Fig. 3
TEP1*R1 is more efficient than TEP1*S3 in parasite killing. (A) Reciprocal allele-specific RNAi. Each box represents a gene. With the use of short dsRNA probes specifically directed against *R1 (dsR) or *S3 (dsS), each TEP1 allele is silenced separately in F1 mosquitoes (open box) allowing to compare the function of each allele in the same genetic background. (B) TEP1 expression in the F1 progeny of crosses between L3-5 females and G3 males (L3-5 x G3) was measured by allele-specific quantitative real-time PCR 3 days after dsRNA-treatment. Expression levels of TEP1*R1 and *S3 were normalized to their levels in the dsLacZ control. Mean (central bar) ± SEM (error bar) of three independent experiments. (C) Parasite counts in the F1 progeny of L3-5 x G3. Results of three independent experiments were pooled, sample sizes are shown in brackets. Mean (central bar) ± SEM (error bar). Significance for differences between groups are indicated (Mann-Whitney on key comparisons): **, p<0.001; ns, not significant.
Fig. 4
Fig. 4
Correlation between TEP1 genotype and phenotype upon P. berghei infection in the F2 generation. (A) Percentages of resistant and melanising mosquitoes for each genotype. Sample sizes are shown in brackets. Significance for differences between groups were calculated taking into account F2-family structure (9): **, p<0.001; *, p<0.05; ns, not significant. (B) Parasite counts in F2 mosquitoes as in Fig. 1A.

References

    1. Collins FH, et al. Science. 1986 Oct 31;234:607. - PubMed
    1. Vernick KD, et al. Exp Parasitol. 1995 Jun;80:583. - PubMed
    1. Zheng L, et al. Science. 1997 Apr 18;276:425. - PubMed
    1. Zheng L, et al. BMC Genet. 2003 Oct 24;4:16. - PMC - PubMed
    1. Blandin S, et al. Cell. 2004 Mar 5;116:661. - PubMed

Publication types

MeSH terms

Substances

Associated data